NCERT solutions for Class 11 Economics (Statistics for Economics) chapter 4 - Presentation of Data [Latest edition]
 chapter 4 - Presentation of Data")

Advertisements
Solutions for chapter 4: presentation of data.
Below listed, you can find solutions for Chapter 4 of CBSE NCERT for Class 11 Economics (Statistics for Economics).
NCERT solutions for Class 11 Economics (Statistics for Economics) Chapter 4 Presentation of Data Exercise [Pages 56 - 57]
Answer the following questions, 1 to 10, choosing the correct answer..
Bar diagram is a ______
one-dimensional diagram
two-dimensional diagram
diagram with no dimension
none of the above
Data represented through a histogram can help in finding graphically the ______
all the above
Ogives can be helpful in locating graphically the ______
Data represented through arithmetic line graph help in understanding ______
long-term trend
cyclicity in data
seasonality in data
The width of bars in a bar diagram need not be equal.
The width of rectangles in a histogram should essentially be equal.
Histogram can only be formed with the continuous classification of data.
Histogram and column diagram is the same method of presentation of data.
The mode of a frequency distribution can be known graphically with the help of a histogram.
The median of a frequency distribution cannot be known from the ogives.
What kinds of diagrams are more effective in representing the following?
Monthly rainfall in a year
Composition of the population of Delhi by religion
Components of cost in a factory
Suppose you want to emphasize the increase in the share of urban non-workers and lower level of urbanization in India as shown in the Census of India, 2001. How would you do it in the tabular form?
How does the procedure of drawing a histogram differ when class intervals are unequal in comparison to equal class intervals in a frequency table?
The Indian Sugar Mills Association reported that ‘Sugar production during the first fortnight of December 2001 was about 3,87,000 tonnes, as against 3,78,000 tonnes during the same fortnight last year (2000). The off-take of sugar from factories during the first fortnight of December 2001 was 2,83,000 tonnes for internal consumption and 41,000 tonnes for exports as against 1,54,000 tonnes for internal consumption and nil for exports during the same fortnight last season.’
Present the data in tabular form.
Suppose you were to present these data in a diagrammatic form which of the diagrams would you use and why?
Present these data diagrammatically.
The following table shows the estimated sectoral real growth rates (percentage change over the previous year) in GDP at factor cost.
|
|
|
|
|
| 1994-95 | 5.0 | 9.2 | 7.0 |
| 1995-96 | -0.9 | 11.8 | 10.3 |
| 1996-97 | 9.6 | 6.0 | 7.1 |
| 1997-98 | -1.9 | 5.9 | 9.0 |
| 1998-99 | 7.2 | 4.0 | 8.3 |
| 1999-2000 | 0.8 | 6.9 | 8.2 |
Represent the data as multiple time-series graphs.
NCERT solutions for Class 11 Economics (Statistics for Economics) chapter 4 - Presentation of Data
Shaalaa.com has the CBSE Mathematics Class 11 Economics (Statistics for Economics) CBSE solutions in a manner that help students grasp basic concepts better and faster. The detailed, step-by-step solutions will help you understand the concepts better and clarify any confusion. NCERT solutions for Mathematics Class 11 Economics (Statistics for Economics) CBSE 4 (Presentation of Data) include all questions with answers and detailed explanations. This will clear students' doubts about questions and improve their application skills while preparing for board exams.
Further, we at Shaalaa.com provide such solutions so students can prepare for written exams. NCERT textbook solutions can be a core help for self-study and provide excellent self-help guidance for students.
Concepts covered in Class 11 Economics (Statistics for Economics) chapter 4 Presentation of Data are Collection of Data, Sources of Data - Primary, Sources of Data - Secondary, Concepts of Sampling, How Basic Data is Collected, Methods of Collecting Data, Some Important Sources of Secondary Data, Organisation of Data, Meaning of Variables, Types of Variables, Organisation of Data - Raw Data, Organisation of Data - Frequency Series, Organisation of Data - Frequency Distribution, Tabular Presentation and Diagrammatic Presentation of Data - Geometric Form, Tabular Presentation and Diagrammatic Presentation of Data - Frequency Diagrams, Abular Presentation and Diagrammatic Presentation of Data - Arithmetic Line Graphs, Introduction to Presentation of Data, Textual Presentation of Data, Tabular Presentation of Data, Tabulation of Data and Parts of a Table, Diagrammatic Presentation of Data, Presentation of Data - Conclusion.
Using NCERT Class 11 Economics (Statistics for Economics) solutions Presentation of Data exercise by students is an easy way to prepare for the exams, as they involve solutions arranged chapter-wise and also page-wise. The questions involved in NCERT Solutions are essential questions that can be asked in the final exam. Maximum CBSE Class 11 Economics (Statistics for Economics) students prefer NCERT Textbook Solutions to score more in exams.
Get the free view of Chapter 4, Presentation of Data Class 11 Economics (Statistics for Economics) additional questions for Mathematics Class 11 Economics (Statistics for Economics) CBSE, and you can use Shaalaa.com to keep it handy for your exam preparation.
- Maharashtra Board Question Bank with Solutions (Official)
- Balbharati Solutions (Maharashtra)
- Samacheer Kalvi Solutions (Tamil Nadu)
- NCERT Solutions
- RD Sharma Solutions
- RD Sharma Class 10 Solutions
- RD Sharma Class 9 Solutions
- Lakhmir Singh Solutions
- TS Grewal Solutions
- ICSE Class 10 Solutions
- Selina ICSE Concise Solutions
- Frank ICSE Solutions
- ML Aggarwal Solutions
- NCERT Solutions for Class 12 Maths
- NCERT Solutions for Class 12 Physics
- NCERT Solutions for Class 12 Chemistry
- NCERT Solutions for Class 12 Biology
- NCERT Solutions for Class 11 Maths
- NCERT Solutions for Class 11 Physics
- NCERT Solutions for Class 11 Chemistry
- NCERT Solutions for Class 11 Biology
- NCERT Solutions for Class 10 Maths
- NCERT Solutions for Class 10 Science
- NCERT Solutions for Class 9 Maths
- NCERT Solutions for Class 9 Science
- CBSE Study Material
- Maharashtra State Board Study Material
- Tamil Nadu State Board Study Material
- CISCE ICSE / ISC Study Material
- Mumbai University Engineering Study Material
- CBSE Previous Year Question Paper With Solution for Class 12 Arts
- CBSE Previous Year Question Paper With Solution for Class 12 Commerce
- CBSE Previous Year Question Paper With Solution for Class 12 Science
- CBSE Previous Year Question Paper With Solution for Class 10
- Maharashtra State Board Previous Year Question Paper With Solution for Class 12 Arts
- Maharashtra State Board Previous Year Question Paper With Solution for Class 12 Commerce
- Maharashtra State Board Previous Year Question Paper With Solution for Class 12 Science
- Maharashtra State Board Previous Year Question Paper With Solution for Class 10
- CISCE ICSE / ISC Board Previous Year Question Paper With Solution for Class 12 Arts
- CISCE ICSE / ISC Board Previous Year Question Paper With Solution for Class 12 Commerce
- CISCE ICSE / ISC Board Previous Year Question Paper With Solution for Class 12 Science
- CISCE ICSE / ISC Board Previous Year Question Paper With Solution for Class 10
- Entrance Exams
- Video Tutorials
- Question Papers
- Question Bank Solutions
- Question Search (beta)
- More Quick Links
- Privacy Policy
- Terms and Conditions
- Shaalaa App
- Ad-free Subscriptions
Select a course
- Class 1 - 4
- Class 5 - 8
- Class 9 - 10
- Class 11 - 12
- Search by Text or Image
- Textbook Solutions
- Study Material
- Remove All Ads
- Change mode
NCERT Solutions for Class 11 Economics -Statistics for Economics – Chapter 4 – Presentation of Data
Exercise : Solutions of Questions on Page Number : 56
Q1 :Bar diagram is a (i) one-dimensional diagram (ii) two-dimensional diagram (iii) diagram with no dimension (iv) none of the above Answer : Bar diagrams are One-dimensional diagrams. These are represented on a plane of two axis and depicts the relationship between the two variables (plotted on the either axis) in form of rectangular bars.
Q2 :Data represented through a histogram can help in finding graphically the (i) mean (ii) mode (iii) median (iv) all the above Answer : Graphically mode can be determined by presenting the data in the form of Histogram. The highest Histogram indicates the modal class. The intersection point of the lines diagonally joining the two top corners of the modal rectangles to the corners of the adjacent Histograms indicates the Modal Value.
Q3 :Ogives can be helpful in locating graphically the (i) mode (ii) mean (iii) median (iv) none of the above Answer : Graphically, Median can be determined by the intersection point of Less than Ogive and More than Ogive. The value of x-axis corresponding to the intersection point indicates the median.
Q4 :Data represented through arithmetic line graph help in understanding (i) long-term trend (ii) cyclicity in data (iii) seasonality in data (iv) all the above Answer : Data represented through arithmetic line graph (or time series graph) helps in understanding the long-term trend and periodicity.
Q5 :Width of bars in a bar diagram need not be equal (True/False). Answer : The above statement is false as all bars in a bar diagram need to be of equal width. Moreover, all bars are at equal distance from each other.
Q6 :Width of rectangles in a histogram should essentially be equal (True/False). Answer : The above statement is false, as the width of all rectangles in a histogram may or may not be equal. The width of a rectangle depends on the width of its corresponding class interval.
Q7 :Histogram can only be formed with continuous classification of data (True/False). Answer : Yes, a Histogram can only be formed with the continuous classification of data. The frequency distribution of a continuous series is graphically presented in form of a Histogram. If the given data is not continuous, then it is to be converted into exclusive series before presenting the data in the form of Histogram. Histograms can never be prepared for discrete series.
Q8 :Histogram and column diagram are the same method of presentation of data (True/False). Answer: The above statement is false. This is because Histogram and column diagram are different method of presentation. While the Histogram is a Two-dimensional diagram, the bar diagram is a One-dimensional diagram. Histograms are prepared for the continuous series, whereas the bar diagrams are prepared for the discrete series. Further, Histograms are drawn continuously without any space between two consecutive Histograms, whereas the space is must between two bars in a bar diagram.
Q9 :Mode of a frequency distribution can be known graphically with the help of histogram (True/False). Answer : The above statement is true. Graphically, mode can be determined by presenting the data in the form of Histogram. The highest Histogram indicates the modal class. The intersection point of the lines diagonally joining the two top corners of the modal rectangles to the corners of the adjacent Histograms indicates the Modal Value.
Q10 :Median of a frequency distribution cannot be known from the ogives (True/False). Answer : The statement is false. Graphically Ogives can be determined by the intersection point of the less than Ogive and more than Ogive. The value of x-axis corresponding to the intersection point indicates the median.
Q11 :What kinds of diagrams are more effective in representing the following? (i) Monthly rainfall in a year (ii) Composition of the population of Delhi by religion (iii) Components of cost in a factory Answer : (i) The monthly rainfall in a year can be best represented by a bar diagram as only one variable i.e. monthly rainfall is to be compared visually. The highest bar diagram indicates the highest rainfall in the corresponding month that is plotted on the x-axis. (ii) Composition of the population of Delhi by religion can be represented by a simple bar diagram. Plotting different religion on the x-axis and the number of people on the y-axis, one can easily compare the number of the population religion-wise.. (iii) In order to represent different components of cost in a factory, a pie chart is more effective. The entire circle represents the total cost and various components of costsare shown by different portions of the circle.
Q12 :Suppose you want to emphasise the increase in the share of urban non-workers and lower level of urbanisation in India as shown in Example 4.2. How would you do it in the tabular form? Answer : Share of Rural and Urban Non-workers in India
Source: Census of India, 2001 We can infer from the above table that the absolute number of the rural non-workers is greater than the absolute number of the urban non-workers. The higher ( lower) share of the rural non-workers (urban non-workers) reveals lower degree of urbanisation in India. NOTE: As there is no Example 4.2 in the book, so the following data have been adapted from Census of India, 2001.
Q13 :How does the procedure of drawing a histogram differ when class intervals are unequal in comparison to equal class intervals in a frequency table? Answer : A Histogram of equal class intervals has equal width of all rectangles indicating the same class intervals. In contrast, a Histogram of unequal class intervals has rectangles of varying width as per their corresponding class intervals. Before constructing a Histogram, frequencies of unequal class intervals are to be adjusted. The adjustment factor of each class is calculated with the following formula.
And the adjusted frequency will be calculated by dividing the original frequency by adjustment factor.
Q14 : The Indian Sugar Mills Association reported that, ‘Sugar production during the first fortnight of December 2001 was about 3,87,000 tonnes, as against 3,78,000 tonnes during the same fortnight last year (2000). The off-take of sugar from factories during the first fortnight of December 2001 was 2,83,000 tonnes for internal consumption and 41,000 tonnes for exports as against 1,54,000 tonnes for internal consumption and nil for exports during the same fortnight last season.’ (i) Present the data in tabular form. (ii) Suppose you were to present these data in diagrammatic form which of the diagrams would you use and why? (iii) Present these data diagrammatically. Answer :
| | | | |
(ii) With a view to present the data diagramatically the multiple bar diagram can be effectiveliy used.

Q15 : The following table shows the estimated sectoral real growth rates (percentage change over the previous year) in GDP at factor cost.
Represent the data as a multiple time series graph Answer:

Type above and press Enter to search. Press Esc to cancel.
- School Solutions
- Star Program
- NCERT Solutions Class 12 Maths
- NCERT Solutions Class 12 Physics
- NCERT Solutions Class 12 Chemistry
- NCERT Solutions Class 12 Biology
- NCERT Solutions Class 12 Commerce
- NCERT Solutions Class 12 Economics
- NCERT Solutions Class 12 Accountancy
- NCERT Solutions Class 12 English
- NCERT Solutions Class 12 Hindi
- NCERT Solutions Class 11 Maths
- NCERT Solutions Class 11 Physics
- NCERT Solutions Class 11 Chemistry
- NCERT Solutions Class 11 Biology
- NCERT Solutions Class 11 Commerce
- NCERT Solutions Class 11 Accountancy
- NCERT Solutions Class 11 English
- NCERT Solutions Class 11 Hindi
- NCERT Solutions Class 11 Statistics
- NCERT Solutions Class 10 Maths
- NCERT Solutions Class 10 Science
- NCERT Solutions Class 10 English
- NCERT Solutions Class 10 Hindi
- NCERT Solutions Class 10 Social Science
- NCERT Solutions Class 9 Maths
- NCERT Solutions Class 9 Science
- NCERT Solutions Class 9 English
- NCERT Solutions Class 9 Hindi
- NCERT Solutions Class 9 Social Science
- NCERT Solutions Class 8 Maths
- NCERT Solutions Class 8 Science
- NCERT Solutions Class 8 English
- NCERT Solutions Class 8 Hindi
- NCERT Solutions Class 8 Social Science
- NCERT Solutions Class 7 Maths
- NCERT Solutions Class 7 Science
- NCERT Solutions Class 7 English
- NCERT Solutions Class 7 Hindi
- NCERT Solutions Class 7 Social Science
- NCERT Solutions Class 6 Maths
- NCERT Solutions Class 6 Science
- NCERT Solutions Class 6 English
- NCERT Solutions Class 6 Hindi
- NCERT Solutions Class 6 Social Science
- NCERT Solutions Class 5 Maths
- NCERT Solutions Class 5 English
- NCERT Solutions Class 5 EVS
- NCERT Solutions Class 4 Maths
- NCERT Solutions Class 4 English
- NCERT Solutions Class 4 EVS
- NCERT Solutions Class 4 Hindi
- NCERT Solutions Class 3 Maths
- NCERT Solutions Class 3 English
- NCERT Solutions Class 3 EVS
- NCERT Solutions Class 3 Hindi
- NCERT Solutions Class 2 Maths
- NCERT Solutions Class 2 English
- NCERT Solutions Class 2 Hindi
- NCERT Solutions Class 1 Maths
- NCERT Solutions Class 1 English
- NCERT Solutions Class 1 Hindi
- NCERT Books Class 12
- NCERT Books Class 11
- NCERT Books Class 10
- NCERT Books Class 9
- NCERT Books Class 8
- NCERT Books Class 7
- NCERT Books Class 6
- NCERT Books Class 5
- NCERT Books Class 4
- NCERT Books Class 3
- NCERT Books Class 2
- NCERT Books Class 1
- Important Questions Class 12
- Important Questions Class 11
- Important Questions Class 10
- Important Questions Class 9
- Important Questions Class 8
- Important Questions Class 7
- important questions class 6
- CBSE Class 12 Revision Notes
- CBSE Class 11 Revision Notes
- CBSE Class 10 Revision Notes
- CBSE Class 9 Revision Notes
- CBSE Class 8 Revision Notes
- CBSE Class 7 Revision Notes
- CBSE Class 6 Revision Notes
- CBSE Class 12 Syllabus
- CBSE Class 11 Syllabus
- CBSE Class 10 Syllabus
- CBSE Class 9 Syllabus
- CBSE Class 8 Syllabus
- CBSE Class 7 Syllabus
- CBSE Class 6 Syllabus
- CBSE Class 5 Syllabus
- CBSE Class 4 Syllabus
- CBSE Class 3 Syllabus
- CBSE Class 2 Syllabus
- CBSE Class 1 Syllabus
- CBSE Sample Question Papers For Class 12
- CBSE Sample Question Papers For Class 11
- CBSE Sample Question Papers For Class 10
- CBSE Sample Question Papers For Class 9
- CBSE Sample Question Papers For Class 8
- CBSE Sample Question Papers For Class 7
- CBSE Sample Question Papers For Class 6
- CBSE Sample Question Papers For Class 5
- CBSE Sample Question Papers For Class 4
- CBSE Sample Question Papers For Class 3
- CBSE Sample Question Papers For Class 2
- CBSE Sample Question Papers For Class 1
- CBSE Previous Year Question Papers Class 12
- CBSE Previous Year Question Papers Class 10
- Extra Questions For Class 8 Maths
- Extra Questions For Class 8 Science
- Extra Questions For Class 9 Maths
- Extra Questions For Class 9 Science
- Extra Questions For Class 10 Maths
- Extra Questions For Class 10 Science
- NEET 2021 Question Paper
- NEET 2020 Question Paper
- NEET 2019 Question Paper
- NEET 2018 Question Paper
- NEET 2017 Question Paper
- NEET 2016 Question Paper
- NEET 2015 Question Paper
- NEET Physics Questions
- NEET Chemistry Questions
- NEET Biology Questions
- NEET Sample Papers
- NEET Physics Syllabus
- NEET Chemistry Syllabus
- NEET Biology Syllabus
- NEET Mock Test
- NEET Eligibility Criteria
- JEE Main 2021 Question Paper
- JEE Main 2020 Question Paper
- JEE Main 2019 Question Paper
- JEE Main 2018 Question Paper
- JEE Main 2017 Question Paper
- JEE Main 2016 Question Paper
- JEE Main 2015 Question Paper
- JEE Main Sample Papers
- JEE Main Physics Syllabus
- JEE Main Chemistry Syllabus
- JEE Main Maths Syllabus
- JEE Main Physics Questions
- JEE Main Chemistry Questions
- JEE Main Maths Questions
- JEE main revision notes
- JEE Main Mock Test
- JEE Advanced Physics Questions
- JEE Advanced Chemistry Questions
- JEE Advanced Maths Questions
- JEE Advanced 2021 Question Paper
- JEE Advanced 2020 Question Paper
- JEE Advanced 2019 Question Paper
- JEE Advanced 2018 Question Paper
- JEE Advanced 2017 Question Paper
- JEE Advanced 2016 Question Paper
- JEE Advanced 2015 Question Paper
- JEE Advanced Physics Syllabus
- JEE Advanced Chemistry Syllabus
- JEE Advanced Maths Syllabus
- JEE Advanced Mock Test
- ISC Class 12 Syllabus
- ISC Class 11 Syllabus
- ICSE Class 10 Syllabus
- ICSE Class 9 Syllabus
- ICSE Class 8 Syllabus
- ICSE Class 7 Syllabus
- ICSE Class 6 Syllabus
- ISC Sample Question Papers for Class 12
- ISC Sample Question Papers for Class 11
- ICSE Sample Question Papers for Class 10
- ICSE Sample Question Papers for Class 9
- ICSE Sample Question Papers for Class 8
- ICSE Sample Question Papers for Class 7
- ICSE Sample Question Papers for Class 6
- ICSE Class 10 Revision Notes
- ICSE Class 9 Revision Notes
- ISC Important Questions for Class 12
- ISC Important Questions for Class 11
- ICSE Important Questions for Class 10
- ICSE Important Questions for Class 9
- ICSE Important Questions for Class 8
- ICSE Important Questions for Class 7
- ICSE Important Questions for Class 6
- ISC Class 12 Question Paper
- ICSE Class 10 Question Paper
- Maharashtra Board Syllabus
- Maharashtra Board Sample Question Paper
- Maharashtra Board Previous Year Question Paper
- AP Board Syllabus
- AP Board Sample Question Paper
- AP Board Previous Year Question Paper
- Tamilnadu Board Syllabus
- Tamilnadu Board Sample Question Paper
- Tamilnadu Board Previous Year Question Paper
- Telangana Board Syllabus
- Telangana Board Sample Question Paper
- Telangana Board Previous Year Question Paper
- Karnataka Board Syllabus
- Karnataka Board Sample Question Paper
- Karnataka Board Previous Year Question Paper
- Examination Full Forms
- Physics Full Forms
- Chemistry Full Forms
- Biology Full Forms
- Educational Full Form
- CUET Eligibility Criteria
- CUET Exam Pattern
- CUET Cutoff
- CUET Syllabus
- CUET Admit Card
- CUET Counselling
- CUET Previous Year Question Papers
- CUET Application Form
- CUET Sample Papers
- CUET Exam Centers
- CUET Exam Dates
- CUET Results
- Physics Formulas
- Chemistry Formulas
- Math Formulas
- Algebra Formulas
- Geometry Formulas
- Trigonometry Formulas
- Subscription
NCERT Solutions Class 11 Statistics Chapter 4
Home » NCERT Solutions » NCERT Solutions Class 11 Statistics Chapter 4

- CBSE Important Questions
- Important Questions Class 6
- CBSE Previous Year Question Papers
- CBSE Revision Notes
- CBSE Syllabus
- CBSE Extra Questions
- CBSE Sample Papers
- ISC & ICSE Syllabus
- ICSE Syllabus Class 9
- ICSE Syllabus Class 8
- ICSE Syllabus Class 7
- ICSE Syllabus Class 6
- ICSE Syllabus Class 10
- ICSE Question Paper
- ICSE Sample Question Papers
- ISC Sample Question Papers For Class 12
- ISC Sample Question Papers For Class 11
- ICSE Sample Question Papers For Class 10
- ICSE Sample Question Papers For Class 9
- ICSE Sample Question Papers For Class 8
- ICSE Sample Question Papers For Class 7
- ICSE Sample Question Papers For Class 6
- ICSE Revision Notes
- ICSE Important Questions
- ISC Important Questions For Class 12
- ISC Important Questions For Class 11
- ICSE Important Questions For Class 10
- ICSE Important Questions For Class 9
- ICSE Important Questions For Class 8
- ICSE Important Questions For Class 7
- ICSE Important Questions For Class 6
- Maharashtra board
- Rajasthan-Board
- Andhrapradesh Board
- AP Board syllabus
- Telangana Board
- Tamilnadu Board
- Tamilnadu Sample Question Paper
- Tamilnadu Syllabus
- Tamilnadu Previous Year Question Paper
- NCERT Solutions Class 12
- NCERT Solutions Class 10
- NCERT Solutions Class 11
- NCERT Solutions Class 9
- NCERT Solutions Class 8
- NCERT Solutions Class 7
- NCERT Solutions Class 6
- NCERT Solutions Class 5
- NCERT Solutions Class 4
- NCERT Solutions Class 3
- NCERT Solutions Class 2
- NCERT Solutions Class 1
- JEE Main Question Papers
- JEE Main Syllabus
- JEE Main Questions
- JEE Main Revision Notes
- JEE Advanced Question Papers
- JEE Advanced Syllabus
- JEE Advanced Questions
- JEE Advanced Sample Papers
- NEET Question Papers
- Neet 2021 Question Paper
- Neet 2020 Question Paper
- Neet 2019 Question Paper
- Neet 2018 Question Paper
- Neet 2017 Question Paper
- Neet 2016 Question Paper
- Neet 2015 Question Paper
- NEET Syllabus

The topic of Statistics deals with the quantification of data. It revolves around specific numbers to represent qualitative information. Simply, it is a collection of data. But that’s not all. As Economics students, one must learn data processing techniques that collect, tabulate, classify and present data. In addition, one needs to learn more about data reduction and condensation. Finally, one must also become familiar with the techniques of data analysis and interpretation. Along with the solutions of NCERT Solutions For Class 11 Statistics Chapter 4 ,Extramarks also provides answers of NCERT Solutions Class 12 for Class 12, NCERT Solutions Class 11 for Class 11, NCERT Solutions Class 10 for Class 10, NCERT Solutions Class 9 for Class 9, NCERT Solutions Class 8 for Class 8 , NCERT Solutions Class 7 for Class 7 and NCERT Solutions Class 6 for Class 6.
Quick Links
NCERT Solutions For Class 11 Statistics Chapter 4 – Presentation of Data
The NCERT Solutions For Class 11 Statistics Chapter 4 ‘Presentation of Data’ is available for reading or download on this page. Students who are in Class 11 or preparing for the Class 11 Statistics exam can refer to the NCERT Solutions For Class 11 Statistics Chapter 4 Statistics Book for review. Class 11 Statistics Chapter 4 e-book PDF is always useful to use when students do not have access to a physical copy.
NCERT Solutions For Class 11 Statistics Chapter 4 Presentation Of Data
All answers to NCERT Solutions For Class 11 Statistics Chapter 4 and Class 11 Statistics NCERT Solutions Chapter 4 are available on Extramarks. The students who are studying Statistics using NCERT textbooks and want to understand Chapter 4 “Presenting Data”. They, after learning the lesson, look for answers in the NCERT Solutions For Class 11 Statistics Chapter 4 to their questions. They can get all the answers in the NCERT Solutions For Class 11 Statistics Chapter 4.
Data Can Be Represented In Two Forms. They Are As Follows:
Today, the presentation of data is paramount. After all, anything beautiful will never fail to capture our attention. Data presentation refers to presenting or establishing data in an attractive and useful way so that it can be easily interpreted. The three main forms of data presentation are:
The discussion of data representation begins with its crudest and most ambiguous form, the textual representation. In such a presentation, the data in question is simply plain text, i.e. usually contained within a paragraph. This is typically used when the data is not very large.
This type of representation is useful when students are looking to supplement qualitative statements with certain data. For this purpose, the data should not be represented too large in tables or charts. It should only be a statement that serves as appropriate evidence for the qualitative evidence and helps the reader form an idea of the extent of a phenomenon. All the related answers are available in the NCERT Solutions For Class 11 Statistics Chapter 4
Tables allow for an attractive, clear, and orderly presentation of even large amounts of data. Data is organized in rows and columns. Because data tables are easy to create and read, they are one of the most common forms of data representation. All the solutions of problems related to Tabular form are easily accessible on the NCERT Solutions For Class 11 Statistics Chapter 4
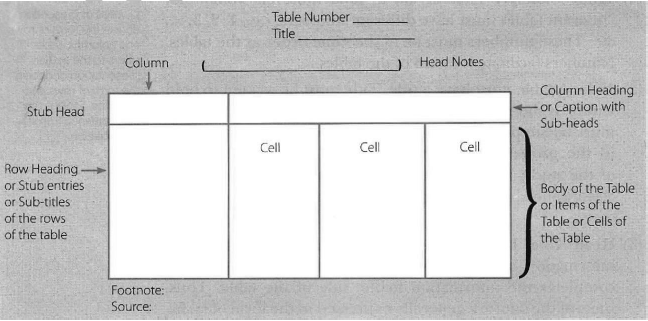
Data table components
Table number: Each table should have a specific table number for easy access and location. This number can be easily mentioned anywhere it serves as a reference, giving students direct access to the date mentioned in that particular table.
Title: The table should include a title that clearly informs the reader of the data included, the period of the study, the location of the study, and how the data is categorized.
Headnotes: Headnotes further support the purpose of the title and give more information about the table. Header notes generally represent units of data within parentheses at the end of the table title.
Stubs: These are the titles of the rows within the table. A stub therefore displays information about the data contained in a particular row.
Caption: Caption is the title of the column in the data table. In fact, this is equivalent to a stub, showing the information contained in the column.
Body or field: The body of a table is the entire contents of the table. Each element of the body is called a “cell”.
Footnotes: Footnotes are rarely used. Add a title for the table, if desired. Source: If data from a secondary source is used, this source should be indicated below the footnote.
Construction of Data Table
Some basic ideas of making a table are:
Title should be appropriate for the purpose of the study: The title of a table should provide an overview of the table.
Compare: If two rows or columns need to be compared, they can be placed close to each other.
Alternate placement of catches: If the rows in the data table are long, the exploits can be placed on the right side of the table.
Title: The title should be written in the singular. For example, `good` instead of `goods`.
Footnotes: Footnotes should only be provided if necessary.
Column size: Column size should be uniform and proportionate. Use abbreviations: Titles and subtitles must not contain abbreviations.
Units: There should be a clear specification of the unit above the columns.
For Diagrammatic representation, a bar chart is one of the most common types of data representation.
Simple bar Diagram
Multi-Bar Chart
Percentage Bar Chart
Sub Divided Bar Chart
All of the above topics have been detailed in Chapter 4 of the NCERT Solution Class 11 Statistics. The 15 questions in this chapter provide an appropriate overview of “Data Presentation”.
Questions Given in the NCERT Solutions for Class 11 Statistics for Economics Chapter 4
Questions that are given in the textbook of NCERT are very important for every student who is preparing for Class 11 Exams. Therefore, Extramarks provides all the solutions of NCERT Solutions For Class 11 Statistics Chapter 4 on the website on Extramarks. Students can refer to the NCERT Solutions For Class 11 Statistics Chapter 4 solutions, as these are prepared by the expert team of Extramarks.
Each question in the NCERT solutions is followed by a correct, concise and relevant answer. The answers given in the NCERT Solutions For Class 11 Statistics Chapter 4 solution also follow the CBSE model of the exam. This helps students have a brief idea of the types of questions they are likely to face in the final exams. Here is an overview of the types of questions in Chapter 4 of the Class 11 Statistics NCERT Solution:
Students of Class 11 have a lot of questions in their NCERT books and for the solutions, they can refer to NCERT Solutions For Class 11 Statistics Chapter 4. No matter what question of the Class 11 Statistics syllabus it is, the answer given in NCERT Solutions For Class 11 Statistics Chapter 4. If a student gets stuck at a question and needs an answer for reference, they can refer to NCERT Solutions For Class 11 Statistics Chapter 4. All answers from Class 11 Statistics are available in NCERT Solutions For Class 11 Statistics Chapter 4. Students can refer to NCERT Solutions For Class 11 Statistics Chapter 4 for answers of all questions.
All the answers are explained lucidly in the NCERT Solutions For Class 11 Statistics Chapter 4. NCERT Solutions For Class 11 Statistics Chapter 4 can be referred to for the answers. For every problem a student cannot solve, solutions are available on the NCERT Solutions For Class 11 Statistics Chapter 4. Students must refer to the NCERT Solutions For Class 11 Statistics Chapter 4 to understand how to form their answers in the actual exam. Students can take help of NCERT Solutions For Class 11 Statistics Chapter 4 for understanding the answers. The answers are available in NCERT Solutions For Class 11 Statistics Chapter 4. One can refer to NCERT Solutions For Class 11 Statistics Chapter 4 even during their revision sessions. Along with that, students also benefit from online courses and online study resources like NCERT Solutions For Class 11 Statistics Chapter 4.
- Click to share on Facebook (Opens in new window)
- Click to share on Twitter (Opens in new window)
- Click to share on LinkedIn (Opens in new window)
- Click to share on WhatsApp (Opens in new window)
FAQs (Frequently Asked Questions)
1. what types of questions are available in ncert answers to statistics class 11 for economics chapter 4.
Chapter 4 of the NCERT Answers to Class 11 Statistics has 15 questions. Some of these questions are conceptual and objective in nature. Some questions in this chapter are based on “true or false” statements. Some questions require students to represent given data. All the solutions can be checked on NCERT Solutions For Class 11 Statistics Chapter 4
2. What does the 11th Class Statistics textbook talk about?
This chapter is about data presentation. Data is information that is collected and needs to be organized to investigate a hypothesis or to come to a conclusion. This chapter covers textual, tabular, and graphical representation of data. The solutions can be easily interpreted from NCERT Solutions For Class 11 Statistics Chapter 4. The data when presented will make it easier for you to study and analyse, and also more appealing to the eye. Data is presented in a clear way that facilitates understanding.
3. Is Class 11 Chapter 4 of Statistics important?
Statistics Chapter 4 Class 11 is a chapter in the Statistics textbook titled Data Presentation. This chapter allows one to understand how one can present and analyse data. Students, consciously or unconsciously, process data, organize it, and use it to achieve better results. Understanding how the data is presented also allows one to intelligently plan the research, prepare and understand how one can use the minimum of resources to achieve maximum results. The knowledge gained in the chapter will be useful in education and in real life.
NCERT Solutions Related Links

Fill this form to view question paper
Otp verification.
Class 11 Statistics Chapter 4 Presentation of Data PDF
NCERT Solutions for Class 11 Statistics, Chapter 4 Presentation of Data, PDF Free Download.
- Chapter 1 Introduction
- Chapter 2 Collection Of Data
- Chapter 3 Organisation Of Data
- Chapter 4 Presentation Of Data
- Chapter 5 Measures Of Central Tendency
- Chapter 6 Measures Of Dispersion
- Chapter 7 Correlation
- Chapter 8 Index Numbers
- Sample Paper
- Question Paper
- NCERT Solutions
- NCERT Books
- NCERT Audio Books
- NCERT Exempler
- Model Papers
- Past Year Question Paper
- Writing Skill Format
- RD Sharma Solutions
- HC Verma Solutions
- CG Board Solutions
- UP Board Solutions
- Careers Opportunities
- Courses & Career
- Courses after 12th
Home » 11th Class » NCERT Book Class 11 Economics Chapter 4 Presentation of Data (PDF)
NCERT Book Class 11 Economics Chapter 4 Presentation of Data (PDF)
NCERT Book Class 11 Economics Chapter 4 Presentation of Data is here. You can read and download Class 11 Economics Chapter 4 PDF from this page of aglasem.com. Presentation of Data is one of the many lessons in NCERT Book Class 11 Economics in the new , updated version of 2023-24 . So if you are in 11th standard , and studying Economics textbook (named Statistics for Economics ), then you can read Ch 4 here and afterwards use NCERT Solutions to solve questions answers of Presentation of Data.
NCERT Book Class 11 Economics Chapter 4 Presentation of Data
The complete Chapter 4 , which is Presentation of Data , from NCERT Books for Class 11 Economics is as follows.
NCERT Book Class 11 Economics Chapter 4 Presentation of Data PDF Download Link – Click Here To Download The Complete Chapter PDF
NCERT Book Class 11 Economics Full Book PDF Download Link – Click Here To Download The Complete Book PDF
NCERT Book Class 11 Economics Chapter 4 Presentation of Data PDF
The direct link to download class 11 Economics NCERT Book PDF for chapter 4 Presentation of Data is given above. However if you want to read the complete lesson on Presentation of Data then that is also possible here at aglasem. So here is the complete class 11 Economics Ch 4 Presentation of Data.

NCERT Book for Class 11 Economics
Besides the chapter on Presentation of Data, you can read or download the NCERT Class 11 Economics PDF full book from aglasem. Here is the complete book:
- Indian Economic Development
- Chapter 1 Indian Economy on the Eve of Independence
- Chapter 2 Indian Economy 1950-1990
- Chapter 3 Liberalisation, Privatisation and Globalisation : An Appraisal
- Chapter 4 Human Capital Formation in India
- Chapter 5 Rural Development
- Chapter 6 Employment: Growth, Informalisation and Other Issues
- Chapter 7 Environment and Sustainable Development
- Chapter 8 Comparative Development Experiences of India and its Neighbours
- Statistics for Economics
- Chapter 1 Introduction
- Chapter 2 Collection of Data
- Chapter 3 Organisation of Data
- Chapter 4 Presentation of Data
- Chapter 5 Measures of Central Tendency
- Chapter 6 Correlation
- Chapter 7 Index Numbers
- Chapter 8 Use of Statistics
- NCERT Books for Class 11
Similarly all the subject-wise class 11 books at aglasem.com are as follows.
- NCERT Book Class 11 Accountancy
- NCERT Book Class 11 Biology
- NCERT Book Class 11 Business Studies
- NCERT Book Class 11 Chemistry
- NCERT Book Class 11 Economics
- NCERT Book Class 11 English
- NCERT Book Class 11 Geography
- NCERT Book Class 11 Hindi
- NCERT Book Class 11 History
- NCERT Book Class 11 Maths
- NCERT Book Class 11 Physics
- NCERT Book Class 11 Political Science
- NCERT Book Class 11 Psychology
- NCERT Book Class 11 Sociology
All class-wise books of National Council of Educational Research and Training are as follows.
- NCERT Books for Class 1
- NCERT Books for Class 2
- NCERT Books for Class 3
- NCERT Books for Class 4
- NCERT Books for Class 5
- NCERT Books for Class 6
- NCERT Books for Class 7
- NCERT Books for Class 8
- NCERT Books for Class 9
- NCERT Books for Class 10
- NCERT Books for Class 12
Class 11 Economics Chapter 4 Presentation of Data NCERT Textbook – An Overview
The highlights of this Presentation of Data chapter PDF are as follows.
| Aspects | Details |
|---|---|
| Class | 11 |
| Subject | Economics |
| Book | Statistics for Economics |
| Chapter Number | Ch 4 |
| Chapter Name | Presentation of Data |
| Book Portion Here | NCERT Book Class 11 Economics Ch 4 Presentation of Data |
| Download Format | |
| Version | NCERT Book (New, Updated) 2023-24 |
| Complete Book | |
| All Class 11 Books | |
| All Textbooks | |
| NCERT Books in Hindi | |
| NCERT Solutions | |
| More Study Material |
If you have any queries on NCERT Book Class 11 Economics Chapter 4 Presentation of Data, then please ask in comments below. And if you found the Class 11 Economics Chapter 4 Presentation of Data PDF helpful, then do share with your friends on telegram, facebook, whatsapp, twitter, and other social media! :)
To get study material, exam alerts and news, join our Whatsapp Channel .
NCERT Book Class 11 Biology Chapter 17 Locomotion and Movement (PDF)
Ncert book class 11 economics chapter 5 measures of central tendency (pdf), related posts.

AP Inter 1st Year Previous Year Question Papers – Download PDF Andhra Pradesh Board PYQP
Ap inter 1st year sanskrit question paper | ap pyqp pdf download, ap inter 1st year surveying theory question paper | ap pyqp pdf download, ap inter 1st year tamil question paper | ap pyqp pdf download, leave a reply cancel reply, cbse board quick links.
- CBSE Date Sheet
- CBSE Result
- CBSE Syllabus
- CBSE Sample Papers
- CBSE Question Papers
- CBSE Practice Papers
CISCE Board Quick Links
- CISCE Time Table
- CISCE Results
- CISCE Specimen Papers
- CISCE Syllabus
- CISCE Question Papers
Class Wise Study Material
Board exams 2023.
- Solved Sample Papers
- Revision Notes
- State Board
Study Material
- Class Notes
- Courses After Class 12th
- JEE Main 2024
- Fashion & Design
- Terms of Use
- Privacy Policy
© 2019 aglasem.com
Discover more from AglaSem Schools
Subscribe now to keep reading and get access to the full archive.
Continue reading
NCERT Solutions For Class 11 Statistics PDF Download
Ncert solutions for class 11 statistics.
Download NCERT Solutions For Class 11 Statistics
- Chapter 1 Introduction
- Chapter 2 Collection of Data
- Ch 3 Organisation of Data
- Chapter 4 Presentation of Data
- Chapter 5 Measures of Central Tendency
- Ch 6 Measures of Dispersion
- Chapter 7 Correlation
- Chapter 8 Index Numbers
NCERT Solutions For Class 11 PDF Download
Ncert books class 11 free pdf download.
Leave a Reply Cancel reply
You must be logged in to post a comment.
- Unusual India
- Breakfast Recipes
- Continental Food Recipes
- Desserts and Sweets Recipes
- Festival and Celebration Cuisines
- Indian Chinese Cuisine
- Indian Main course Recipes
- Indian Pickles and Chutney Recipes
- Indian Raita Recipes
- Indian Starters Recipes
- Indian Street Food Recipes
- Indian Vegetarian Recipes
- Italian Food Recipes
- Book Reviews
- Indian Restaurant Food Reviews
- Upcoming Movies
- Election Updates
- Automobiles
- Social Issues
- Subcontinent
- Uncategorized
- Sign in / Join
Chapter 4 – Presentation of Data Questions and Answers: NCERT Solutions for Class 11 Economics(Statistics for Economics)
Class 11 Economics(Statistics for Economics) NCERT book solutions for Chapter 4 - Presentation of Data Questions and Answers.

Question 1. Bar diagram is a (a) one-dimensional diagram (b) two-dimensional diagram (c) diagram with no dimension (d) None of these
Answer: (a) bar diagrams are one-dimensional diagrams. though these are represented on a plane of two axis in form of rectangular bars, the width is of no consequence and only the length depicts the frequency., question 2. data represented through a histogram can help in finding graphically the (a) mean (b) mode (c) median (d) all of these, answer: (b) histogram gives value of mode of the frequency distribution graphically through the highest rectangle., question 3. ogives can be helpful in locating graphically the (a) mode (b) mean (c) median (d) none of these, answer: (c) intersection point of the less than and more than ogives gives the median., question 4. data represented through arithmetic line graph help in understanding (a) long term trend (b) cyclicity in data (c) seasonality in data (d) all of the above, answer: (a) arithmetic line graph helps in understanding the trend, periodicity, etc in a long term time series data., question 5. width of bars in a bar diagram need not be equal. (true/false), answer: false bar diagram comprises a group of equispaced and equiwidth rectangular bars for each class or category of data., question 6. width of rectangles in a histogram should essentially be equal. (true/false), answer: false if the class intervals are of equal width, the area of the rectangles are proportional to their respective frequencies and width of rectangles will be equal. however, sometimes it is convenient or necessary to use varying width of class intervals and hence unequal width of rectangles., question 7. histogram can only be formed with continuous classification of data. (true/false), answer: true a histogram is never drawn for a discrete variable/data. if the classes are not continuous they are first converted into continuous classes., question 8. histogram and column diagram are the same method of presentation of data. (true/false), answer: false histogram is a two dimensional diagram drawn for continuous data and the rectangles do not have spaces in between while column diagram is one dimensional with space in between every column (bar)., question 9. mode of a frequency distribution can be known graphically with the help of histogram. (true/false), answer: true histogram gives value of mode of the frequency distribution graphically through the highest rectangle., question 10. median of a frequency distribution cannot be known from the ogives. (true/false), answer: false intersection-point of the less than and more than ogives gives the median., question 11. what kind of diagrams are more effective in representing the following (a) monthly rainfall in a year (b) composition of the population of delhi by religion (c) components of cost in a factory, answer: (a) the monthly rainfall in a year can be best represented by a bar diagram as only one variable i.e., monthly rainfall is to be presented diagrammatically. the rainfall is plotted on y-axis in the corresponding month that is plotted on the x-axis. (b) composition of the population of delhi by religion can be represented by a component bar diagram. a component bar diagram shows the bar and its sub-divisions into two or more components. thus, the total population can be sub divided in terms of religion and presented through a component bar diagram. (c) different components of cost in a factory can most effectively be depicted through a pie chart. the circle represents the total cost and various components of costs are shown by different portions of the circle drawn according to percentage of total cost each component covers., question 12. suppose you want to emphasise the increase in the share of urban non-workers and lower level of urbanisation in india as shown in example 4.2. how would you do it in the tabular form, answer: share of urban workers and non workers in india, location sex worker in urban (in crore) non-worker in urban (in crore) total male 50 70 120 femal 25 50 75 total 75 120 195, question 13. how does the procedure of drawing a histogram differ when class intervals are unequal in comparison to equal class intervals in a frequency table, answer: a histogram is a set of rectangles with bases as the intervals between class boundaries (along x-axis) and with areas proportional to the class frequency. if the class intervals are of equal width, the area of the rectangles are proportional to their respective frequencies. however, sometimes it is convenient or at times necessary, to use varying width of class intervals. for graphical representation of such data, height for area of a rectangle is the quotient of height i.e., frequency and base i.e., width of the class interval. when intervals are equal, all rectangles have the same base and area can conveniently be represented by the frequency of the interval. but, when bases vary in their width, the heights of rectangles are to be adjusted to yield comparable measurements by dividing class frequency by width of the class interval instead of absolute frequency. this gives us the frequency density for the purpose of comparison. thusfrequency density(height of rectangle)=class frequencywidth of the class interval, question 14. the indian sugar mills association reported that, ‘sugar production during the first fortnight of december, 2001 was about 3,87,000 tonnes, as against 3,78,000 tonnes during the same fortnight last year (2000). the off-take of sugar from factories during the first fortnight of december, 2001 was 2,83,000 tonnes for internal consumption and 41,000 tonnes for exports as against 1,54,000 tonnes for internal consumption and nil for exports during the same fortnight last season.’ (i) present the data in tabular form. (ii) suppose you were to present these data in diagrammatic form which of the diagrams would you use and why (iii) present these data diagrammatically., answer: (i) data in tabular form. sugar production in india, total production (tonnes) off-take for internal consumption (tonnes) off-take for exports (tonnes) december 2000 378000 154000 — december 2001 387000 283000 41000 (ii) the data can effectively be presented diagrammatically using the multiple bar diagram. this is because multiple bar diagrams are used for comparing two or more sets of data for different years or classes, etc..

Question 15. The following table shows the estimated sectoral real growth rates (percentage change over the previous year) in GDP at factor cost.

Represent the data as multiple time-series graphs.

RELATED ARTICLES MORE FROM AUTHOR
Purvodaya plan: meaning, objectives, economic impact and implementation strategies, what is university grants commission’s project asmita, indian medical association (ima): meaning, history and significance.
Advertisements
CBSE NCERT Solutions
NCERT and CBSE Solutions for free
Presentation of Data Class 11 Statistics Notes And Questions
Please refer to Presentation of Data Class 11 Statistics notes and questions with solutions below. These Class 11 Statistics revision notes and important examination questions have been prepared based on the latest Statistics books for Class 11. You can go through the questions and solutions below which will help you to get better marks in your examinations.
Class 11 Statistics Presentation of Data Notes and Questions
The presentation of data means exhibition of the data in such a dear and attractive manner that these are easily understood and analysed. There are many forms of presentation of data of which the following three are well known: (i) Textual or Descriptive Presentation, (ii) Tabular Presentation, and (iii) Diagrammatic Presentation. The present chapter focuses on Textual and Tabular Presentation of data. Diagrammatic Presentation of data is discussed in the next chapter.
1. TEXTUAL PRESENTATION In textual presentation, data are a part of the text of study or a part of the description of the subject matter of study. Such a presentation is also called descriptive presentation of data. This is the most common form of data presentation when the quantity of data is not very large. Here are some examples:
Example 1 In a strike call given by the trade unions of shoe making industry in the city of Delhi, 50% of the workers reported for the duty, and only 2 out of the 20 industries in the city were totally closed.
Example 2 Surveys conducted by a Non-government Organisation reveal that, in the state of Punjab, area under pulses has tended to shrink by 40% while the area under rice and wheat has tended to expand by 20%, between the years 2001-2011.
Suitability Textual presentation of data is most suitable when the quantum of data is not very large. A small volume of data presented as a part of the subject matter of study becomes a useful supportive evidence to the text. Thus, rather than saying that price of gold is skyrocketing, a statement like price of gold has risen by 50% during the financial year 2017- 18 is much more meaningful and precise. One need not support the text with voluminous data in the form of tables or diagram when the textual matter itself is very small and includes only a few observations. Indeed, textual presentation of data is an integral component of a small quantitative description of a phenomenon. It gives an emphasis of statistical truth to the otherwise qualitative observations.
Drawbacks A serious drawback of die textual presentation of data is that one has to go through the entire text before quantitative facts about a phenomenon become evident. A picture or a set of bars showing increase in the price of gold during a specified period is certainly quite informative even on a casual glance of the reader. Textual presentation of data, on the other hand, does not offer anything to the reader at a mere glance of the text matter. The reader must read and comprehend (he entire text. When the subject under study is vast and involves comparison across different areas/countries, textual presentation of data would only add to discomfort of the reader.
2. TABULAR PRESENTATION In the words of Neiswanger, “A statistical table is a systematic organisation of data in columns and rows” Vertical dissections of table (||) are known as columns and horizontal dissections (=) are known as rows.
Tabulation is the process of presenting data in the form of a table. According to Prof. L.R. Connor, ‘tabulation involves the orderly and systematic presentation of numerical data in a form designed to elucidate the problem under consideration. ”
In the words of Prof. M.M. Blair, “Tabulation in its broadest sense is an orderly arrangement of data in columns and rows.”
Components of a Table Following are the principal components of a table:
(1) Table Number: First of all, a table must be numbered. Different tables must have different numbers, e.g., 1, 2, 3, etc. These numbers must be in the same order as the tables. Numbers facilitate location of the tables.
(2) Title: A table must have a title. Title must be written in bold letters. It should attract the attention of the readers. The title must be simple, clear and short. A good title must reveal: (i) the problem under consideration, (ii) the time period of the study, (iii) the place of study, and (iv) the nature of classification of data. A good title is short but complete in all respects.
(3) Head Note: If the title of the table does not give complete information, it is supplemented with a head note. Head note completes the information in the title of the table. Thus, units of the data are generally expressed in the form of lakhs, tonnes, etc. and preferably in brackets as a head-note.
(4) Stubs: Stubs are titles of the rows of a table. These titles indicate information contained in the rows of the table.
(5) Caption: Caption is the title given to the columns of a table. A caption indicates information contained in the columns of the table. A caption may have sub-heads when information contained in the columns is divided in more than one class. For example, a caption of ‘Students’ may have boys and girls as sub-heads.
(6) Body or Field: Body of a table means sum total of the items in the table. Thus, body is the most important part of a table. It indicates values of the various items in the table. Each item in the body is called ‘cell’.
(7) Footnotes: Footnotes are given for clarification of the reader. These are generally given when information in the table need to be supplemented. «
(8) Source: When tables are based on secondary data, source of the data is to be given. Source of the data is specified below the footnote. It should give: name of the publication and publisher, year of publication, reference, page number, etc.
Difference between Table and Tabulation
While tabulation refers to the method or process of presenting data in the form of rows and columns, table refers to the actual presentation of data in the form of rows and columns. Table is the consequence (result) of tabulation.
Check [he following format of a table showing its various components:
Guidelines for the Construction of a Table or Features of a Good Table
Construction of a table depends upon the objective of study. It also depends upon the wisdom of the statistician. There are no hard and fast rules for the construction of a table. However, some important guidelines should be kept in mind. These guidelines are features of a good table. These are as under:
(1) Compatible Title: Title of a table must be compatible with the objective of the study. The title should be placed at the top centre of the table.
(2) Comparison: It should be kept in mind that items (cells) which are to be compared with each other are placed in columns or rows close to each other. This facilitates comparison.
(3) Special Emphasis: Some items in the table may need special emphasis. Such items should be placed in the head rows (top above) or head columns (extreme left). Moreover, such items should be presented in bold figures.
(4) Ideal Size: Table must be of an ideal size. To determine an ideal size of a table, a rough draft or sketch must be drawn. Rough draft will give an idea as to how many rows and columns should be drawn for presentation of the data.
(5) Stubs: If rows are very long, stubs may be given at the right hand side of the table also.
(6) Use of Zero: Zero should be used only to indicate the quantity of a variable. It should not be used to indicate the non-availability of data. If the data are not available, it should be indicated by ‘n.a.’ or (-) hyphen sign.
(7) Headings: Headings should generally be written in the singular form. For example, in the columns indicating goods, the word ‘good’ should be used.
(8) Abbreviations: Use of abbreviations should be avoided in the headings or subheadings of the table. Short forms of the words such as Govt., m.p. (monetary policy), etc. should not be used. Also such signs as “(ditto)” should not be used in the body of the table.
(9) Footnote: Footnote should be given only if needed. However, if footnote is to be given, it must bear some asterisk mark (*) corresponding to the concerned item. (10) Units: Units used must be specified above the columns. If figures are very large, units may be noted in the short form as ‘000’ hectare or ‘000’ tonnes.
(11) Total: In the table, sub-totals of the items must be given at the end of each row. Grand total of the items must also be noted.
(12) Percentage and Ratio: Percentage figures should be provided in the table, if possible. This makes the data more informative.
(13) Extent of Approximation: If some approximate figures have been used in the table, the extent of approximation must be noted. This may be indicated at the top of the table as a part of head note or at the foot of the table as a footnote.
(14) Source of Data: Source of data must be noted at the foot of the table. It is generally noted next to the footnote.
(15) Size of Columns: Size of the columns must be uniform and symmetrical.
(16) Ruling of Columns: Columns may be divided into different sections according to similarities of the data.
(17) Simple, Economical and Attractive: A table must be simple, attractive and economical in space.
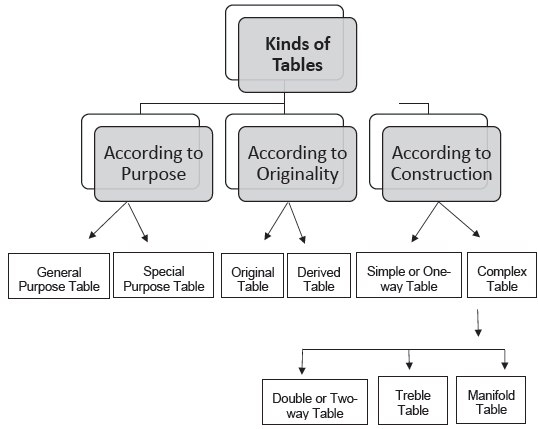
Kinds of Tables There are three basis of classifying tables, viz., (1) purpose of a table, (2) originality of a table, and (3) construction of a table. According to each of these bases, statisticians have classified tables as in the following flow chart:
Let us attempt a brief description of the various kinds of tables:
(1) Tables according to Purpose
According to purpose, there are two kinds of tables:
(i) General Purpose Table: General purpose table is that table which is of general use. It does not serve any specific purpose or specific problem under consideration. Such tables are just ‘data bank’ for the use of researchers for their various studies. These tables are generally attached to some official reports, like Census Reports oflndia. These are also called Reference Tables.
(ii) Special Purpose Table: Special purpose table is that table which is prepared with some specific purpose in mind. Generally, these are small tables limited to the problem under consideration. In these tables data are presented in the form of result of the analysis. That is why these tables are also called summary tables.
(2) Tables according to Originality On the basis of originality, tables are of two kinds: (i) Original Table: An original table is that in which data are presented in the same form and manner in which they are collected. (ii) Derived Table: A derived table is that in which data are not presented in the form or manner in which these are collected. Instead the data are first converted into ratios or percentage and then presented.
(3) Tables according to Construction
According to construction, tables are of two kinds:
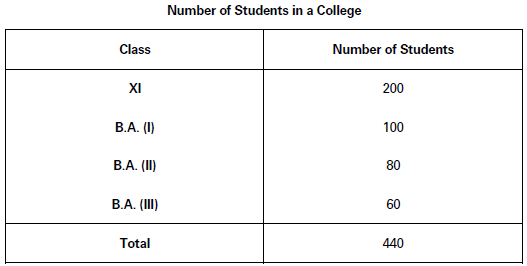
(i) Simple or One-way Table: A simple table is that which shows only one characteristic of the data. Table 2 below is an example of a simple table. It shows number of students in a college:
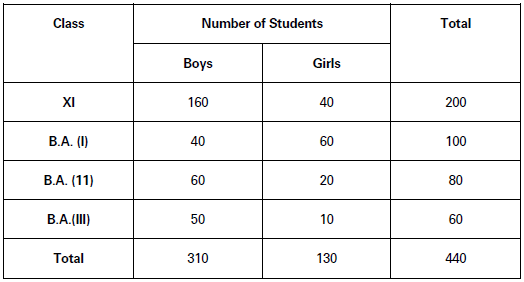
(ii) Complex Table: A complex table is one which shows more than one characteristic of the data. On the basis of the characteristics shown, these tables may be further classified as:
(a) Double or Two-way Table: A two-way table is that which shows two characteristics of the data. For example, Table 3, showing the number of students in different classes according to their sex, is a two-way table: Number of Students in a College (According to Sex and Class)
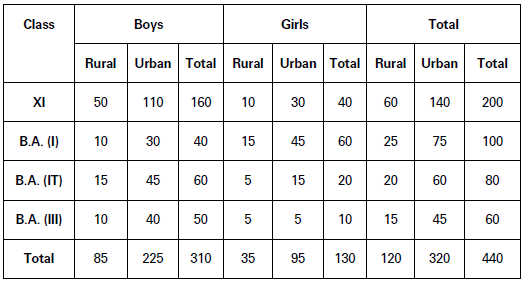
(b) Treble Table: A treble table is that which shows three characteristics of the data. For example, Table 4 shows number of students in a college according to class, sex and habitation. Number of Students in a College (According to Class, Sex and Habitation)
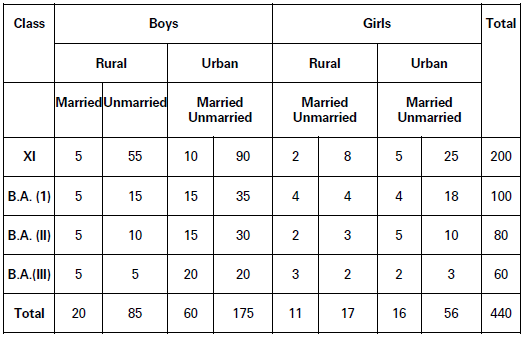
(c) Manifold Table: A manifold table is the one which shows more than three characteristics of the data. Table 5, for example, shows number of students in a college according to their sex, class, habitation and marital status. Number of Students in a College (According to their Sex, Class, Habitation and Marital Status)
Classification of Data and Tabular Presentation Tabular presentation is based on four-fold classification of data, viz., qualitative, quantitative, temporal, and spatial. Following are the details with suitable illustrations.
(1) Qualitative Classification of Data and Tabular Presentation: Qualitative classification occurs when data are classified on the basis of qualitative attributes or qualitative characteristics of a phenomenon. Example: Data of unemployment may relate to rural-urban areas, skilled and unskilled workers, or male and female job-seekers. Table 6 below is an example of tabular presentation of data when data are classified on the basis of qualitative attributes or qualitative characteristics.
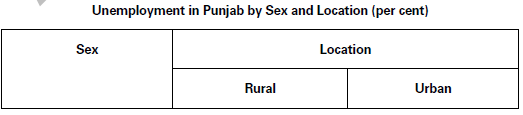
(This is an imaginary table. In this table, male and female are such characteristics/attributes which are qualitative and cannot be quantified.)
(2) Quantitative Classification of Data and Tabular Presentation: Quantitative classification occurs when data are classified on the basis of quantitative characteristics of a phenomenon.
Example: Data on marks in Mathematics by the students of Class XII in CBSE examination. Table 7 shows tabular presentation of data when data are classified on the basis of quantitative characteristics.
Marks Obtained by Students of Class XII of XYZ School
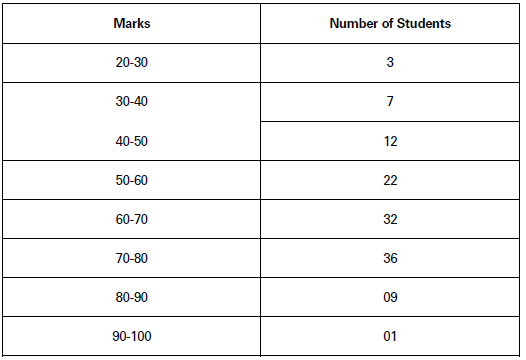
Source: Result Sheets Here, marks are a quantifiable variable and data are classified in terms of different class intervals of marks.
(3) Temporal Classification of Data and Tabular Presentation:
In temporal classification, data are classified according to time, and time becomes the classifying variable.
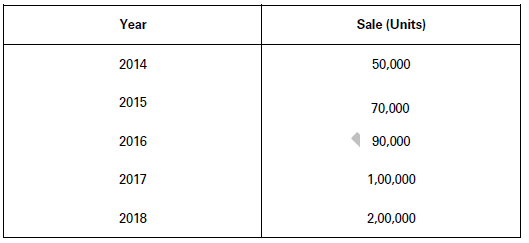
Example: Sale of Cell phones in different years during the period 2014-2018 in the city of Delhi. Table 8 shows tabular presentation of data on the basis of temporal classification.
Annual Sale of Cell Phones in the City of Delhi (2014-2018)
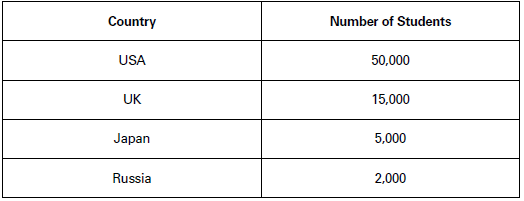
(4) Spatial Classification : In spatial classification, place/location becomes the classifying variable. It may be a village, a town, a district, a state or a country as a whole. Example: Number of Indian students studying in different countries of the world during a particular year. Table 9 is an example of tabular presentation based on spatial classification of data.
Indian Students in different Countries of the World (2018)
Merits of Tabular Presentation Following are the principal merits of tabular presentation of data:
(1) Simple and Brief Presentation: Tabular presentation is perhaps the most simplest form of data presentation. Data, therefore, are easily understood. Also, a large volume of statistical data is presented in a very brief form.
(2) Facilitates Comparison: The tabulation facilitates comparison of data by presenting the data in different classes.
(3) Easy Analysis: It is very easy to analyse the data from tables. It is by organising the data in the form of table that one finds out their central tendency, dispersion and correlation.
(4) Highlights Characteristics of Data: Tabulation highlights characteristics of data. Accordingly, it becomes easy to remember the statistical facts.
(5) Economical: Tabular presentation is a very economical mode of data presentation. It saves time as well as space.

Related Posts

Class 11 Physics Notes And Questions

Introduction Class 11 Statistics Notes And Questions

Small Business and Entrepreneurship Class 11 Business Studies Notes And Questions
- NCERT Solutions for Class 12-Science
- NCERT Solutions for Class 12-Commerce
- NCERT Solutions for Class 12-Humanities
- NCERT Solutions for Class 11-Science
- NCERT Solutions for Class 11-Commerce
- NCERT Solutions for Class 11-Humanities
- NCERT Solutions for Class 10
- NCERT Solutions for Class 9
- NCERT Solutions for Class 8
- NCERT Solutions for Class 7
- NCERT Solutions for Class 6
- NCERT Solutions for Class 5
- NCERT Solutions for Class 4
- NCERT Solutions for Class 3
- NCERT Solutions for Class 2
- NCERT Solutions for Class 1
RD Sharma Solutions
- RD Sharma Solutions for Class 12-Science
- RD Sharma Solutions for Class 11-Science
- RD Sharma Solutions for Class 10
- RD Sharma Solutions for Class 9
- RD Sharma Solutions for Class 8
- RD Sharma Solutions for Class 7
- RD Sharma Solutions for Class 6
RS Aggarwal Solutions
- RS Aggarwal Solutions for Class 10
- RS Aggarwal Solutions for Class 9
- RS Aggarwal Solutions for Class 8
- RS Aggarwal Solutions for Class 7
- RS Aggarwal Solutions for Class 6
TS Grewal Solutions
- TS Grewal Solutions for Class 12- Commerce
- TS Grewal Solutions for Class 11- Commerce
Lakhmir Singh Solutions
- Lakhmir Physics Solutions for Class 10
- Lakhmir Physics Solutions for Class 9
- Lakhmir Chemistry Solutions for Class 10
- Lakhmir Chemistry Solutions for Class 9
- Lakhmir Biology Solutions for Class 10
HC Verma Solutions
- HC Verma Solutions for Class 12-Science
- HC Verma Solutions for Class 11-Science
Homework Questions
- Homework Questions for Class 6
- Homework Questions for Class 7
- Homework Questions for Class 8
- Homework Questions for Class 9
- Homework Questions for Class 10
- Homework Questions for Class 11-Science
- Homework Questions for Class 11-Commerce
- Homework Questions for Class 11-Humanities
- Homework Questions for Class 12-Science
- Homework Questions for Class 12-Commerce
- Homework Questions for Class 12-Humanities
CBSE Board Paper Solutions
- CBSE Class 10 Results
- CBSE Class 10 Board Exam Resources
- CBSE Class 10 Board Paper Solutions for Math
- CBSE Class 10 Board Paper Solutions for Science
- CBSE Class 10 Board Paper Solutions for Social Science
- CBSE Class 10 Board Paper Solutions for English
- CBSE Class 10 Board Paper Solutions for Hindi
- CBSE Class 12-Science Board Paper Solutions for Math
- CBSE Class 12-Science Board Paper Solutions for Physics
- CBSE Class 12-Science Board Paper Solutions for Chemistry
- CBSE Class 12-Science Board Paper Solutions for Biology
- CBSE Class 12-Commerce Board Paper Solutions for Economics
- CBSE Class 12-Commerce Board Paper Solutions for Accountancy
- CBSE Class 12-Commerce Board Paper Solutions for Business Studies
- CBSE Class 12-Commerce Board Paper Solutions for Math
- CBSE Class 12-Humanities Board Paper Solutions for English
FREE Downloadable NCERT Solutions. Works without internet
Previous Year Papers
Presentation of data -->.
Chapter "Presentation of Data" has approximately 127 questions. You can access textbook questions as well as additional Zigya Questions, Competition and Exam Questions with solutions.
Click on the type of questions you would like to study.
Textbook Questions
Zigya questions, other chapters textbook solutions | additional questions, introduction, collection of data, organisation of data, presentation of data, measures of central tendency, measures of dispersion, correlation, index numbers, use of statistical tools, ncert solutions textbook solutions | additional questions.
- Submit Blog
- Terms of Use
- Privacy Policy
Competitions
- NEET - English Medium
- NEET - Gujarati Medium
- JEE - English Medium
- JEE - Gujarati Medium
- GUJCET - Gujarati Medium
- Assam Board
- Manipur Board
- CBSE - English Medium
- CBSE - Hindi Medium
- Hariyana Board - English Medium
- Haryana Board - Hindi Medium
- Himachal Pradesh Board
- Himachal Board - Hindi
- Gujarat Board
- Tripura Board
- Jammu and Kashmir Board
- Karnataka Board
- Meghalaya Board
- Mizoram Board
- Maharashtra Board
- Nagaland Board
- Punjab Board
- Rajasthan Board - English Medium
- Rajasthan Board - Hindi Medium
- Uttarakhand Board - English
- Uttarakhand Board - Hindi
Institutions
- Universities
- Top Ranked List
Test Series
Test yourself, study abroad.
- Study in UAE
- Study in UK
- Study in Ireland
- Study in NewZealand
- Study in Australia
- Study in Canada
232, Block C-3, Janakpuri, New Delhi, Delhi - 110058

Contact Us
+91 9560766379
© 2024 Zigya Technology Labs Pvt. Ltd.
- Andhra Pradesh
- Chhattisgarh
- West Bengal
- Madhya Pradesh
- Maharashtra
- Jammu & Kashmir
- NCERT Books 2022-23
- NCERT Solutions
- NCERT Notes
- NCERT Exemplar Books
- NCERT Exemplar Solution
- States UT Book
- School Kits & Lab Manual
- NCERT Books 2021-22
- NCERT Books 2020-21
- NCERT Book 2019-2020
- NCERT Book 2015-2016
- RD Sharma Solution
- TS Grewal Solution
- TR Jain Solution
- Selina Solution
- Frank Solution
- Lakhmir Singh and Manjit Kaur Solution
- I.E.Irodov solutions
- ICSE - Goyal Brothers Park
- ICSE - Dorothy M. Noronhe
- Micheal Vaz Solution
- S.S. Krotov Solution
- Evergreen Science
- KC Sinha Solution
- ICSE - ISC Jayanti Sengupta, Oxford
- ICSE Focus on History
- ICSE GeoGraphy Voyage
- ICSE Hindi Solution
- ICSE Treasure Trove Solution
- Thomas & Finney Solution
- SL Loney Solution
- SB Mathur Solution
- P Bahadur Solution
- Narendra Awasthi Solution
- MS Chauhan Solution
- LA Sena Solution
- Integral Calculus Amit Agarwal Solution
- IA Maron Solution
- Hall & Knight Solution
- Errorless Solution
- Pradeep's KL Gogia Solution
- OP Tandon Solutions
- Sample Papers
- Previous Year Question Paper
- Important Question
- Value Based Questions
- CBSE Syllabus
- CBSE MCQs PDF
- Assertion & Reason
- New Revision Notes
- Revision Notes
- Question Bank
- Marks Wise Question
- Toppers Answer Sheets
- Exam Paper Aalysis
- Concept Map
- CBSE Text Book
- Additional Practice Questions
- Vocational Book
- CBSE - Concept
- KVS NCERT CBSE Worksheets
- Formula Class Wise
- Formula Chapter Wise
- JEE Previous Year Paper
- JEE Mock Test
- JEE Crash Course
- JEE Sample Papers
- Important Info
- SRM-JEEE Previous Year Paper
- SRM-JEEE Mock Test
- VITEEE Previous Year Paper
- VITEEE Mock Test
- BITSAT Previous Year Paper
- BITSAT Mock Test
- Manipal Previous Year Paper
- Manipal Engineering Mock Test
- AP EAMCET Previous Year Paper
- AP EAMCET Mock Test
- COMEDK Previous Year Paper
- COMEDK Mock Test
- GUJCET Previous Year Paper
- GUJCET Mock Test
- KCET Previous Year Paper
- KCET Mock Test
- KEAM Previous Year Paper
- KEAM Mock Test
- MHT CET Previous Year Paper
- MHT CET Mock Test
- TS EAMCET Previous Year Paper
- TS EAMCET Mock Test
- WBJEE Previous Year Paper
- WBJEE Mock Test
- AMU Previous Year Paper
- AMU Mock Test
- CUSAT Previous Year Paper
- CUSAT Mock Test
- AEEE Previous Year Paper
- AEEE Mock Test
- UPSEE Previous Year Paper
- UPSEE Mock Test
- CGPET Previous Year Paper
- Crash Course
- Previous Year Paper
- NCERT Based Short Notes
- NCERT Based Tests
- NEET Sample Paper
- Previous Year Papers
- Quantitative Aptitude
- Numerical Aptitude Data Interpretation
- General Knowledge
- Mathematics
- Agriculture
- Accountancy
- Business Studies
- Political science
- Enviromental Studies
- Mass Media Communication
- Teaching Aptitude
- Verbal Ability & Reading Comprehension
- Logical Reasoning & Data Interpretation
- CAT Mock Test
- CAT Important Question
- CAT Vocabulary
- CAT English Grammar
- MBA General Knowledge
- CAT Mind Map
- CAT Study Planner
- CMAT Mock Test
- SRCC GBO Mock Test
- SRCC GBO PYQs
- XAT Mock Test
- SNAP Mock Test
- IIFT Mock Test
- MAT Mock Test
- CUET PG Mock Test
- CUET PG PYQs
- MAH CET Mock Test
- MAH CET PYQs
- NAVODAYA VIDYALAYA
- SAINIK SCHOOL (AISSEE)
- Mechanical Engineering
- Electrical Engineering
- Electronics & Communication Engineering
- Civil Engineering
- Computer Science Engineering
- CBSE Board News
- Scholarship Olympiad
- School Admissions
- Entrance Exams
- All Board Updates
- Miscellaneous
- State Wise Books
- Engineering Exam
NCERT Solutions for Class 11 Economics Presentation of Data PDF Download
The answers in the NCERT Solutions for Class 11 Economics Presentation of Data are explained in a point wise manner so that students can understand all types of questions. Through this point wise approach, students can solve doubts and confusions; accordingly can score well in questions related to Class 11 Economics Presentation of Data.
NCERT Solutions for Class 11 Economics Presentation of Data PDF
The Presentation of Data is the important one which utilises multiple concepts to give students a holistic overview. To have a proper holistic overview, students need to practise more and more questions from the NCERT Solutions for Class 11 Economics Presentation of Data PDF. This portable document format of Presentation of Data questions is easily available on the Selfstudys website.
How to Download the NCERT Solutions for Class 11 Economics Presentation of Data?
To download the NCERT Solutions for Class 11 Economics Presentation of Data, students need to follow the given steps; those steps are:
- Visit the Selfstudys website.

- Bring the arrow towards the NCERT Books & Solutions which can be seen in the navigation bar.
- A drop down will appear, select NCERT Solutions from the list.

- A new page will appear, select Class 11th from the list of classes.

- Now select Economics from the list of subjects.
- Again a new page will appear. Now students can select Presentation of Data to solve questions and refer to answers.
Features of the NCERT Solutions for Class 11 Economics Presentation of Data
The features of the NCERT Solutions for Class 11 Economics Presentation of Data are considered to be important part; some of the features are discussed below:
- Formulas are Included: Questions in the NCERT Solutions for Class 11 Economics Presentation of Data revision includes formulas so that students can understand the question and formula in a better way.
- Numerical Questions are Given: In the NCERT Solutions for Class 11 Economics Presentation of Data theory, numerical questions are given. So that students can learn to approach numerical questions of Presentation of Data.
- All Levels of Questions are Asked: Inside the NCERT Solutions for Class 11 Economics Presentation of Data PDF, all levels of questions are included so that students don’t feel confused while attempting the final exam.
- Theory Based Questions are Included: Theory based questions of Presentation of Data questions are included in the NCERT Solutions so that by practising students can get theoretical knowledge.
- Available in the PDF: The questions of from NCERT Class 11 Economics Solutions are available in the portable document format so that students can d0wnload from their electronic device.
- Free Accessibility: Students can access the Presentation of Data questions from the Class 11 NCERT Economics Solutions at any hour of the day as it is easy accessibility.
Benefits of the NCERT Solutions for Class 11 Economics Presentation of Data
While and after solving the questions from the NCERT Solutions for Class 11 Economics Presentation of Data can be benefited a lot, those benefits are:
- Provides Foundation: By solving Presentation of Data questions from the NCERT Class 11 Economics Solutions, students can build a strong and solid foundation. By building a strong foundation, students can score good marks in the Presentation of Data questions.
- Get an Idea Important Topics: Solving questions from the NCERT Solutions for Class 11 Economics Presentation of Data revision can help students to get an idea about important topics and concepts.
- Explains in an Easy Language: Answers in the NCERT Solutions for Class 11 Economics Presentation of Data theory are explained in an easy language so that students can easily understand all levels of questions without any difficulty.
- Helpful for Exam Preparation: In the NCERT Solutions for Class 11 Economics Presentation of Data PDF, all the questions and answers are explained in a proper way so automatically students can prepare well for the final exam.
- Saves Time: Students can save their time as well as effort to search Class 11 Economics questions and answers as it is already available in the NCERT Solutions of Presentation of Data.
- Offers Plenty of Questions to Practise: The NCERT Class 11 Economics Solutions for Presentation of Data offers plenty of questions to practise. By practising these questions, students can easily build a strong foundation.
How to Implement the NCERT Solutions for Class 11 Economics Presentation of Data in the Preparation?
To implement the NCERT Solutions for Class 11 Economics Presentation of Data in the preparation, students can follow the given steps; those steps are:
- Read the Chapter: To implement the NCERT Solutions for Class 11 Economics Presentation of Data revision in the preparation, students need to first read the chapter in a proper way. By understanding the chapter in a proper way, students can remember the important topics while solving questions from Presentation of Data.
- Solve the Questions: After reading Presentation of Data, students are advised to solve questions from the Class 11 Economics textbook. It is advisable for students to solve questions on their own before referring to the NCERT Solutions for Class 11 Economics Presentation of Data theory.
- Refer to the Solutions: Once students solve questions, students need to refer to the NCERT Solutions for Class 11 Economics Presentation of Data PDF so that they can match their answers.
- Practise More Questions: Students are advised to solve Presentation of Data questions from the NCERT Class 11 Economics Solutions.
- Revise Regularly: To implement the Presentation of Data questions from the NCERT Class 11 Economics Solutions in the preparation, students need to revise the whole chapter regularly. By revising, students can keep the concepts of Economics Presentation of Data fresh in their mind.
- Seek Help: In order to implement the Presentation of Data questions from the NCERT Class 11 Solutions in the preparation, students need to seek help from the concerned teachers. By seeking the required help, students can score well in the Presentation of Data Economics questions.
When to Utilise NCERT Solutions for Class 11 Economics Presentation of Data in the Effective Way?
To utilise the NCERT Solutions for Class 11 Economics Presentation of Data in the effective way; some of it are discussed below:
- To Have a Conceptual Understanding: The NCERT Solutions for Class 11 Economics Presentation of Data revision can be utilised to clarify doubts and to get a deep understanding of concepts.
- To Complete Homework Assignments: The NCERT Solutions for Class 11 Economics Presentation of Data theory can be utilised to complete the homework assignments and accordingly can check the answers.
- To Prepare for Exams: Students can prefer utilising the NCERT Solutions for Class 11 Economics Presentation of Data PDF to understand the concepts and improve problem solving skills. By understanding the concepts of Presentation of Data, students can prepare well for the Class 11 Economics final exam.
- To Revise: Through the Class 11 NCERT Economics Solutions, students need to revise the concepts and topics of Presentation of Data.
- For Self Assessment: In order to self assess while preparing for Presentation of Data, students can prefer utilising the NCERT Class 11 Economics Solutions. By self assessment, students can identify the weak areas of Presentation of Data and accordingly they can work upon.
- After Completing the Chapter: Once students complete Presentation of Data from the Class 11 Economics textbook, they can prefer utilising the NCERT Solutions to practise more and more questions.
How to Analyse the Mistakes After Solving Questions from the NCERT Solutions for Class 11 Economics Presentation of Data?
It is important for students to analyse the mistakes after solving questions from the NCERT Solutions for Class 11 Economics Presentation of Data; steps to analyse are discussed below:
- Identify the Mistakes: After solving NCERT Solutions for Class 11 Economics Presentation of Data revision, students need to identify the mistakes. Accordingly they can identify what kind of mistakes they have made: misinterpretation of Presentation of Data questions, conceptual error.
- Understand the Cause: Once students have identified the mistakes while attempting questions from NCERT Solutions for Class 11 Economics Presentation of Data revision, they need to understand the cause of the mistakes. Understanding the cause of the mistakes after attempting Presentation of Data questions, students can minimise the mistakes in future.
- Correct the Mistakes: At the moment they identify the cause of mistakes after solving questions from the NCERT Solutions for Class 11 Economics Presentation of Data theory, they need to rectify the mistakes. By rectifying the mistakes, students can build a strong foundation for the Class 11 Economics Presentation of Data.
- Keep a Record: It is advisable for students to keep a record of mistakes after solving questions from NCERT Solutions for Class 11 Economics Presentation of Data PDF so that they keep a track of their progress.
- Practise Same Questions: Students need to practise the same set of Presentation of Data questions from the NCERT Class 11 Economics Solutions so that they can rectify the mistakes easily.
- Stay Motivated: To rectify all the mistakes after solving Presentation of Data questions from the NCERT Class 11 Economics Solutions, students need to stay motivated and focused.

- NCERT Solutions for Class 12 Maths
- NCERT Solutions for Class 10 Maths
- CBSE Syllabus 2023-24
- Social Media Channels
- Login Customize Your Notification Preferences

One Last Step...

- Second click on the toggle icon

Provide prime members with unlimited access to all study materials in PDF format.
Allow prime members to attempt MCQ tests multiple times to enhance their learning and understanding.
Provide prime users with access to exclusive PDF study materials that are not available to regular users.
NCERT Solutions For Class 11 Statistics PDF Download
Ncert solutions for class 11 statistics.
Download NCERT Solutions For Class 11 Statistics
- Chapter 1 Introduction
- Chapter 2 Collection of Data
- Ch 3 Organisation of Data
- Chapter 4 Presentation of Data
- Chapter 5 Measures of Central Tendency
- Ch 6 Measures of Dispersion
- Chapter 7 Correlation
- Chapter 8 Index Numbers
NCERT Solutions For Class 11 PDF Download
Ncert books for class 11 free pdf download.
Leave a Reply Cancel reply
You must be logged in to post a comment.
Learn CBSE Statistics for Economics Index Terms for Class 11, Chapter 4 Presentation of Data
Statistics for economics for class 11 chapter 4 presentation of data.
1. Bar Diagram – The pictorial representation of grouped data, in the form of vertical or horizontal rectangular bars, where the lengths of the bars are equivalent to the measure of data, are known as bar graphs, bar diagrams, or bar charts.
The bars drawn are of uniform width, and the variable quantity is represented on one of the axes. Also, the measure of the variable is depicted on the other axes. The heights or the lengths of the bars denote the value of the variable, and these graphs are also used to compare certain quantities. The frequency distribution tables can be easily represented using bar charts which simplify the calculations and understanding of data.
2. Simple Bar Diagram – A simple bar diagram is used to illustrate the data having only one variable that is classified on a temporal, quantitative, or spatial basis. In a simple bar diagram, one makes the bars with equal widths with varying lengths, that is, the vastness of a quantity portrayed by the length or height of the bars.
3. Multiple Bar Diagram – In a multiple bar diagram, different components are shown in different bars, and not more than three items can be shown comfortably. It can be used to compare the relative importance of different components.
In other words, a bar diagram is used to represent just one set of data. Therefore, when there are two or more sets of data that need to be represented and compared on the same graph, a multiple bar diagram or component bar diagram is used.
4. Component Bar Diagram – Component bar diagrams are also called sub diagrams that represent different components of a single piece of data. A pie chart is also used to represent a similar distribution of data, but it is a circular diagram, unlike a component bar diagram which is rectangular.
In other words, subdivided bar diagrams are those diagrams that simultaneously present total values as well as part values of a set of data. Different parts of a bar must be shown in the same order for all bars of a diagram.
5. Pie Diagram or Pie Chart – The “pie chart” is also known as a “circle chart”, dividing the circular statistical graphic into sectors or sections to illustrate the numerical problems. Each sector denotes a proportionate part of the whole. To find out the composition of something, Pie-chart works the best at that time. In most cases, pie charts replace other graphs like bar graphs, line plots, histograms, etc.
6. Histogram – A histogram is a graphical representation of a grouped frequency distribution with continuous classes. It is an area diagram and can be defined as a set of rectangles with bases along with the intervals between class boundaries and with areas proportional to frequencies in the corresponding classes. In such representations, all the rectangles are adjacent since the base covers the intervals between class boundaries. The heights of rectangles are proportional to corresponding frequencies of similar classes, and for different classes, the heights will be proportional to corresponding frequency densities.
In other words, a histogram is a diagram involving rectangles whose area is proportional to the frequency of a variable, and the width is equal to the class interval.
7. Frequency Polygon – A frequency polygon is almost identical to a histogram, which is used to compare sets of data or to display a cumulative frequency distribution. It uses a line graph to represent quantitative data. Frequency polygons are a visually substantial method of representing quantitative data and its frequencies.
8. Mode – In statistics, the mode is the value that is repeatedly occurring in a given set. We can also say that the value or number in a data set, which has a high frequency or appears more frequently, is called mode or modal value. It is one of the three measures of central tendency, apart from mean and median. For example, the mode of the set {3, 7, 8, 8, 9} is 8. Therefore, for a finite number of observations, we can easily find the mode. A set of values may have one mode or more than one mode, or no mode at all.
9. Ogive – The ogive is defined as the frequency distribution graph of a series. The ogive is a graph of a cumulative distribution, which explains data values on the horizontal plane axis and either the cumulative relative frequencies, the cumulative frequencies, or cumulative percent frequencies on the vertical axis.
Cumulative frequency is defined as the sum of all the previous frequencies up to the current point. To find the popularity of the given data or the likelihood of the data that fall within a certain frequency range, the ogive curve helps in finding those details accurately.
10. Median – The median of a set of data is the middlemost number or centre value in the set. The median is also the number that is halfway into the set.
To find the median, the data should be arranged, first, in order of least to greatest or greatest to the least value. A median is a number that is separated by the higher half of a data sample, a population, or a probability distribution, from the lower half. The median is different for different types of distribution.
For example, the median of 3, 3, 5, 9, and 11 is 5. If there is an even number of observations, then there is no single middle value; the median is then usually defined to be the mean of the two middle values: so the median of 3, 5, 7, 9 is (5+7)/2 = 6.
11. Arithmetic Line Graph – A graph showing arithmetic values of a variable is called an ‘Arithmetic-line graph’. Often such graphs are constructed to present time series data, that is, the data corresponding to different weeks, months, or years. Therefore, arithmetic-line graphs are often called ‘time series graphs’.
We hope that the offered Statistics for Economics Index Terms for Class 11 with respect to Chapter 4: Presentation of Data will help you.
Related Links:
- Class 11 Statistics for Economics Terms – Chapter 1: Introduction
- Class 11 Statistics for Economics Terms – Chapter 2: Collection of Data
- Class 11 Statistics for Economics Terms – Chapter 3: Organisation of Data
- Class 11 Statistics for Economics Terms – Chapter 5: Measures of Central Tendency
- Class 11 Statistics for Economics Terms – Chapter 7: Correlation
- Class 11 Statistics for Economics Terms – Chapter 8: Index Numbers
- Class 11 Statistics for Economics Terms – Chapter 9: Use of Statistical Tools
| COMMERCE Related Links | |
Register with BYJU'S & Download Free PDFs
Register with byju's & watch live videos.
NCERT Solutions for Class 6, 7, 8, 9, 10, 11 and 12
Statistics for Economics Class 11 NCERT Solutions
January 18, 2024 by Veerendra
Statistics for Economics Class 11 NCERT Solutions by TR Jain & VK Ohri and Sandeep Garg.
NCERT Solutions for Class 11 Economics: Statistics for Economics
- Chapter 1 Introduction
- Chapter 2 Collection of Data
- Chapter 3 Organisation of Data
- Chapter 4 Presentation of Data
- Chapter 5 Measures of Central Tendency
- Chapter 6 Measures of Dispersion
- Chapter 7 Correlation
- Chapter 8 Index Numbers
Class 11 Indian Economic Development NCERT Solutions
Class 11 economics ncert solutions, free resources.
NCERT Solutions
Quick Resources
IMAGES
VIDEO
COMMENTS
Statistics for Economics Class 11 NCERT Solutions Chapter 4 Presentation of Data Answer: the following questions, 1 to 10, choosing the correct answer. Question 1. Bar diagram is a (a) one-dimensional diagram (b) two-dimensional diagram (c) diagram with no dimension (d) None of these Answer: (a) Bar diagrams are one-dimensional diagrams.
NCERT Solution for Class 11 Commerce Statistics Chapter 4 - Presentation of Data furnishes students with all-inclusive data on all the concepts. As the students have to learn the basic fundamentals of the subject of Statistics in Class 11, they need to study the concepts in a detailed way.
NCERT Solutions for Class 11 Statistics Chapter 4 - Presentation of Data Commerce students of Class 11 have Statistics as one of the core subjects in their curriculum. When it comes to Statistics, students require an in-depth understanding of each concept. Regular practice and revision are equally essential to score well in this subject.
This NCERT Solutions for Class 11 Economics contains answers of all questions asked in Chapter 4 in textbook, Statistics for Economics. Therefore you can refer it to solve Presentation of Data exercise questions and learn more about the topic.
Solutions for Chapter 4: Presentation of Data Below listed, you can find solutions for Chapter 4 of CBSE NCERT for Class 11 Economics (Statistics for Economics).
NCERT Solutions for Class 11 Economics Statistics Chapter 4 "Presentation of Data," focuses on the visual and systematic representation of organized data to make it easily understandable and interpretable.
Chapter 4 Presentation of Data Define tabulation. What is a derived table? Write the limitations of diagrammatic presentation? List some advantages of graphs?
Get step by step NCERT solutions for Class 11 Economics-statistics-for-economics Chapter 4 - Presentation of Data. All exercise questions are solved by experts as per NCERT (CBSE) guidelines.
Download NCERT Solutions for Class 11 Statistics Chapter 4 Presentation of Data prepared by subject experts as per the latest NCERT books to score marks in the exam.
NCERT Solutions for Class 11 Statistics, Chapter 4 Presentation of Data, PDF Free Download.
So if you are in 11th standard, and studying Economics textbook (named Statistics for Economics ), then you can read Ch 4 here and afterwards use NCERT Solutions to solve questions answers of Presentation of Data.
Download NCERT Solutions For Class 11 Statistics. Chapter 1 Introduction. Chapter 2 Collection of Data. Ch 3 Organisation of Data. Chapter 4 Presentation of Data. Chapter 5 Measures of Central Tendency. Ch 6 Measures of Dispersion. Chapter 7 Correlation. Chapter 8 Index Numbers.
Statistics for Economics Class 11 Notes Chapter 4 Presentation of Data. In textual presentation, data are a part of the text of study or a part of the description of the subject matter of study. (i) Qualitative Classification of Data and Tabular Presentation Qualitative classification occurs when data are classified on the basis of qualitative ...
Class 11 Economics(Statistics for Economics) NCERT book solutions for Chapter 4 - Presentation of Data Questions and Answers.
Please refer to Presentation of Data Class 11 Statistics notes and questions with solutions below. These Class 11 Statistics revision notes and important examination questions have been prepared based on the latest Statistics books for Class 11. You can go through the questions and solutions below which will help you to get better marks in your examinations.
These solutions for Presentation Of Data are extremely popular among class 11 Commerce students for Economics Presentation Of Data Solutions come handy for quickly completing your homework and preparing for exams. All questions and answers from the NCERT Book of class 11 Commerce Economics Chapter 4 are provided here for you for free.
Presentation of Data Chapter 4 NCERT solutions for Statistics Class 11 Free online NCERT Textbook Questions, Additional Zigya Questions
The answers in the NCERT Solutions for Class 11 Economics Presentation of Data are explained in a point wise manner so that students can understand all types of questions. Through this point wise approach, students can solve doubts and confusions; accordingly can score well in questions related to Class 11 Economics Presentation of Data.
Download NCERT Solutions For Class 11 Statistics. Chapter 1 Introduction. Chapter 2 Collection of Data. Ch 3 Organisation of Data. Chapter 4 Presentation of Data. Chapter 5 Measures of Central Tendency. Ch 6 Measures of Dispersion. Chapter 7 Correlation. Chapter 8 Index Numbers.
Statistics for Economics for Class 11 Chapter 4 Presentation of Data 1. Bar Diagram - The pictorial representation of grouped data, in the form of vertical or horizontal rectangular bars, where the lengths of the bars are equivalent to the measure of data, are known as bar graphs, bar diagrams, or bar charts.
Learn the concepts of Class 11 Economics Presentation of Data with Videos and Stories. Define two way tables and their interpretation.
NCERT Solutions for Class 11 Economics: Statistics for Economics. Chapter 1 Introduction. Chapter 2 Collection of Data. Chapter 3 Organisation of Data. Chapter 4 Presentation of Data. Chapter 5 Measures of Central Tendency. Chapter 6 Measures of Dispersion. Chapter 7 Correlation. Chapter 8 Index Numbers.