

5 Reasons Why Data Analytics is Important in Problem Solving
Data analytics is important in problem solving and it is a key sub-branch of data science. Even though there are endless data analytics applications in a business, one of the most crucial roles it plays is problem-solving.
Using data analytics not only boosts your problem-solving skills, but it also makes them a whole lot faster and efficient, automating a majority of the long and repetitive processes.
Whether you’re fresh out of university graduate or a professional who works for an organization, having top-notch problem-solving skills is a necessity and always comes in handy.
Everybody keeps facing new kinds of complex problems every day, and a lot of time is invested in overcoming these obstacles. Moreover, much valuable time is lost while trying to find solutions to unexpected problems, and your plans also get disrupted often.
This is where data analytics comes in. It lets you find and analyze the relevant data without too much of human-support. It’s a real time-saver and has become a necessity in problem-solving nowadays. So if you don’t already use data analytics in solving these problems, you’re probably missing out on a lot!
As the saying goes from the chief analytics officer of TIBCO,
“Think analytically, rigorously, and systematically about a business problem and come up with a solution that leverages the available data .”
– Michael O’Connell.
In this article, I will explain the importance of data analytics in problem-solving and go through the top 5 reasons why it cannot be ignored. So, let’s dive into it right away.
Highly Recommended Articles:
13 Reasons Why Data Analytics is Important in Decision Making
This is Why Business Analytics is Vital in Every Business
Is Data Analysis Qualitative or Quantitative? (We find Out!)
Will Algorithms Erode our Decision-Making Skills?
What is Data Analytics?
Whenever you perform any operation on any data, intending to explore that data and find different trends or conclusions in it, you’re analyzing the data, which’s exactly what we call data analytics.
Data analytics is the art of automating processes using algorithms to collect raw data from multiple sources and transform it. This results in achieving the data that’s ready to be studied and used for analytical purposes, such as finding the trends, patterns, and so forth.
Businesses are using data analytics in a variety of ways. From predicting their customer behaviors to making more informed business decisions, analytics is everywhere. A recent survey shows that around 94% of enterprises believe that data and analytics are important to their growth.
Why is Data Analytics Important in Problem Solving?
Problem-solving and data analytics often proceed hand in hand. When a particular problem is faced, everybody’s first instinct is to look for supporting data. Data analytics plays a pivotal role in finding this data and analyzing it to be used for tackling that specific problem.
Although the analytical part sometimes adds further complexities, since it’s a whole different process that might get challenging sometimes, it eventually helps you get a better hold of the situation.
Also, you come up with a more informed solution, not leaving anything out of the equation.
Having strong analytical skills help you dig deeper into the problem and get all the insights you need. Once you have extracted enough relevant knowledge, you can proceed with solving the problem.
However, you need to make sure you’re using the right, and complete data, or using data analytics may even backfire for you. Misleading data can make you believe things that don’t exist, and that’s bound to take you off the track, making the problem appear more complex or simpler than it is.
Let’s see a very straightforward daily life example to examine the importance of data analytics in problem-solving; what would you do if a question appears on your exam, but it doesn’t have enough data provided for you to solve the question?
Obviously, you won’t be able to solve that problem. You need a certain level of facts and figures about the situation first, or you’ll be wandering in the dark.
However, once you get the information you need, you can analyze the situation and quickly develop a solution. Moreover, getting more and more knowledge of the situation will further ease your ability to solve the given problem. This is precisely how data analytics assists you. It eases the process of collecting information and processing it to solve real-life problems.

5 Reasons Why Data Analytics Is Important in Problem Solving
Now that we’ve established a general idea of how strongly connected analytical skills and problem-solving are, let’s dig deeper into the top 5 reasons why data analytics is important in problem-solving .
1. Uncover Hidden Details
Data analytics is great at putting the minor details out in the spotlight. Sometimes, even the most qualified data scientists might not be able to spot tiny details existing in the data used to solve a certain problem. However, computers don’t miss. This enhances your ability to solve problems, and you might be able to come up with solutions a lot quicker.
Data analytics tools have a wide variety of features that let you study the given data very thoroughly and catch any hidden or recurring trends using built-in features without needing any effort. These tools are entirely automated and require very little programming support to work. They’re great at excavating the depths of data, going back way into the past.
2. Automated Models
Automation is the future. Businesses don’t have enough time nor the budget to let manual workforces go through tons of data to solve business problems.
Instead, what they do is hire a data analyst who automates problem-solving processes, and once that’s done, problem-solving becomes completely independent of any human intervention.
The tools can collect, combine, clean, and transform the relevant data all by themselves and finally using it to predict the solutions. Pretty impressive, right?
However, there might be some complex problems appearing now and then, which cannot be handled by algorithms since they’re completely new and nothing similar has come up before. But a lot of the work is still done using the algorithms, and it’s only once in a blue moon that they face something that rare.
However, there’s one thing to note here; the process of automation by designing complex analytical and ML algorithms might initially be a bit challenging. Many factors need to be kept in mind, and a lot of different scenarios may occur. But once it goes up and running, you’ll be saving a significant amount of manpower as well as resources.
3. Explore Similar Problems
If you’re using a data analytics approach for solving your problems, you will have a lot of data available at your disposal. Most of the data would indirectly help you in the form of similar problems, and you only have to figure out how these problems are related.
Once you’re there, the process gets a lot smoother because you get references to how such problems were tackled in the past.
Such data is available all over the internet and is automatically extracted by the data analytics tools according to the current problems. People run into difficulties all over the world, and there’s no harm if you follow the guidelines of someone who has gone through a similar situation before.
Even though exploring similar problems is also possible without the help of data analytics, we’re generating a lot of data nowadays , and searching through tons of this data isn’t as easy as you might think. So, using analytical tools is the smart choice since they’re quite fast and will save a lot of your time.
4. Predict Future Problems
While we have already gone through the fact that data analytics tools let you analyze the data available from the past and use it to predict the solutions to the problems you’re facing in the present, it also goes the other way around.
Whenever you use data analytics to solve any present problem, the tools you’re using store the data related to the problem and saves it in the form of variables forever. This way, similar problems faced in the future don’t need to be analyzed again. Instead, you can reuse the previous solutions you have, or the algorithms can predict the solutions for you even if the problems have evolved a bit.
This way, you’re not wasting any time on the problems that are recurring in nature. You jump directly onto the solution whenever you face a situation, and this makes the job quite simple.
5. Faster Data Extraction
New data analytics tools are coming out every day, with each of them getting better and better. When businesses approach solving a problem, most of their time is spent on data acquisition and getting the data ready to be used in solving the problem.
However, with the latest tools, the data extraction is greatly reduced, and everything is done automatically with no human intervention whatsoever.
Moreover, once the appropriate data is mined and cleaned, there are not many hurdles that remain, and the rest of the processes are done without a lot of delays.
When businesses come across a problem, around 70%-80% is their time is consumed while gathering the relevant data and transforming it into usable forms. So, you can estimate how quick the process could get if the data analytics tools automate all this process.
Even though many of the tools are open-source, if you’re a bigger organization that can spend a bit on paid tools, problem-solving could get even better. The paid tools are literal workhorses, and in addition to generating the data, they could also develop the models to your solutions, unless it’s a very complex one, without needing any support of data analysts.
What problems can data analytics solve? 3 Real-World Examples
Employee performance problems .
Imagine a Call Center with over 100 agents
By Analyzing data sets of employee attendance, productivity, and issues that tend to delay in resolution. Through that, preparing refresher training plans, and mentorship plans according to key weak areas identified.
Sales Efficiency Problems
Imagine a Business that is spread out across multiple cities or regions
By analyzing the number of sales per area, the size of the sales reps’ team, the overall income and disposable income of potential customers, you can come up with interesting insights as to why some areas sell more or less than the others. Through that, prepping a recruitment and training plan or area expansion in order to boost sales could be a good move.
Business Investment Decisions Problems
Imagine an Investor with a portfolio of apps/software)
By analyzing the number of subscribers, sales, the trends in usage, the demographics, you can decide which peace of software has a better Return on Investment over the long term.
Data analytics is a sub-field of data science and plays a major role in problem-solving. It makes it easy for us to extract and gather information from various sources and combine it to use it in our solutions effectively. More the information we can gather, the easier tackling the problem gets for us.
Throughout the article, we’ve seen various reasons why data analytics is very important for problem-solving.
Many different problems that may seem very complex in the start are made seamless using data analytics, and there are hundreds of analytical tools that can help us solve problems in our everyday lives.
Emidio Amadebai
As an IT Engineer, who is passionate about learning and sharing. I have worked and learned quite a bit from Data Engineers, Data Analysts, Business Analysts, and Key Decision Makers almost for the past 5 years. Interested in learning more about Data Science and How to leverage it for better decision-making in my business and hopefully help you do the same in yours.
Recent Posts
Causal vs Evidential Decision-making (How to Make Businesses More Effective)
In today’s fast-paced business landscape, it is crucial to make informed decisions to stay in the competition which makes it important to understand the concept of the different characteristics and...
Bootstrapping vs. Boosting
Over the past decade, the field of machine learning has witnessed remarkable advancements in predictive techniques and ensemble learning methods. Ensemble techniques are very popular in machine...
How to analyze a problem
May 7, 2023 Companies that harness the power of data have the upper hand when it comes to problem solving. Rather than defaulting to solving problems by developing lengthy—sometimes multiyear—road maps, they’re empowered to ask how innovative data techniques could resolve challenges in hours, days or weeks, write senior partner Kayvaun Rowshankish and coauthors. But when organizations have more data than ever at their disposal, which data should they leverage to analyze a problem? Before jumping in, it’s crucial to plan the analysis, decide which analytical tools to use, and ensure rigor. Check out these insights to uncover ways data can take your problem-solving techniques to the next level, and stay tuned for an upcoming post on the potential power of generative AI in problem-solving.
The data-driven enterprise of 2025
How data can help tech companies thrive amid economic uncertainty
How to unlock the full value of data? Manage it like a product
Data ethics: What it means and what it takes
Author Talks: Think digital
Five insights about harnessing data and AI from leaders at the frontier
Real-world data quality: What are the opportunities and challenges?
How a tech company went from moving data to using data: An interview with Ericsson’s Sonia Boije
Harnessing the power of external data
What are your chances of acceptance?
Calculate for all schools, your chance of acceptance.
Your chancing factors
Extracurriculars.
Guide to SAT Math Problem Solving and Data Analysis + Practice Questions
Do you know how to improve your profile for college applications.
See how your profile ranks among thousands of other students using CollegeVine. Calculate your chances at your dream schools and learn what areas you need to improve right now — it only takes 3 minutes and it's 100% free.
Show me what areas I need to improve
What’s Covered:
Overview of sat math problem solving and data analysis, how will the sat impact my college chances.
- Strategies for Problem Solving and Data Analysis Questions
- Practice Questions for Problem Solving and Data Analysis
Final Tips and Strategies
Problem Solving and Data Analysis questions appear on the Calculator section of the SAT Math test and involve applying mathematical knowledge to real-world contexts. These problems can be tough, so if you want to improve your math score, here are some strategies and practice problems to help you out.
The SAT Math section contributes to half of the total SAT score. This section is scored out of 800 and includes three main categories, which each have a subscore out of 15.
Here is the breakdown of each category:
- Heart of Algebra: 33%
- Problem Solving and Data Analysis: 29%
- Passport to Advanced Math: 28%
Additional Topics in Math covers the remaining 10% and consists of a variety of different mathematical topics.
The Problem Solving and Data Analysis section tests students’ ability to solve real-world problems using mathematical understanding and skills. This includes quantitative reasoning, interpreting and synthesizing data, and creating representations. These questions never appear on the SAT No Calculator section, so you’ll always be allowed a calculator for them.
Problem Solving and Data Analysis questions ask students to:
- Use ratios, rates, proportional relationships, and scale drawings to solve single- and multistep problems.
- Solve single- and multi-step problems involving percentages.
- Solve single- and multi-step problems involving measurement quantities, units, and unit conversion.
- Given a scatterplot, use linear, quadratic, or exponential models to describe how the variables are related.
- Use the relationship between two variables to investigate key features of the graph.
- Compare linear growth with exponential growth.
- Use two-way tables to summarize categorical data and relative frequencies, and calculate conditional probability.
- Make inferences about population parameters based on sample data.
- Use statistics to investigate measures of center of data and analyze shape, center, and spread.
- Evaluate reports to make inferences, justify conclusions, and determine appropriateness of data collection methods.
Many selective colleges use a metric called the Academic Index (AI) to assess an application’s strength. The AI is calculated based on GPA and SAT/ACT scores, so you should make sure your scores are competitive to increase your chances of admission. Some colleges even automatically reject applicants with AIs that are too low.
To see how your SAT score compares, use CollegeVine’s free Admissions Chances Calculator . This tool will let you know the impact of your SAT score on your chances and will even offer advice to improve other aspects of your profile.

Strategies to Solve Problem Solving and Data Analysis Problems
Problem Solving and Data Analysis problems often involve graphs or data tables, so it’s important to pay attention to titles and labels to make sure you don’t misinterpret the information.
As you read the question, underline or circle any important numeric information. Also, pay close attention to what exactly the question is asking for.
Because Problem Solving and Data Analysis problems vary, there is no concrete algorithm to approach them. These questions are typically more conceptual than calculation-based, so though a calculator is allowed, you probably won’t need it aside from simple arithmetic. Therefore, the key to these problems is reading carefully and knowing concepts like proportions, median, mean, percent increase, etc.
10 Difficult Problem Solving and Data Analysis Questions
Here are some sample difficult Problem Solving and Data Analysis questions and explanations of how to solve them. Remember, these questions only appear on the Calculator section of the exam, so you will have access to a calculator for all of them.
1. Measures of Central Tendency (Mean/Median/Mode)
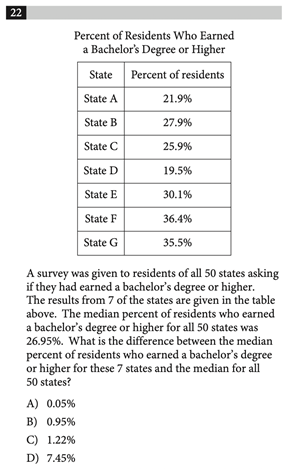
Correct Answer: B
This problem involves computing the median. If you have a graphing calculator, this could be done via lists, but since there are only 7 data values, it might be faster to just write this one out. The median is the measure of the middle of the data set, so start by ordering the values from smallest to largest. This results in the following list: 19.5%, 21.9%, 25.9%, 27.9%, 30.1%, 35.5%, 36.4%. From here, we can clearly see that the middle value is 27.9%, so that is our median.
However, we’re not done here. We now have to compute the difference between the median we just calculated and the median for all 50 states, 26.95%. Subtracting these two values yields 0.95%, which corresponds to answer choice B.

2. Percent Increase
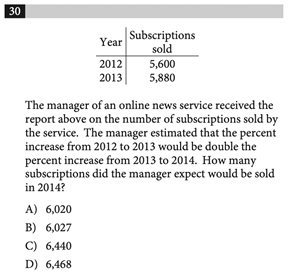
Percent increase can be a tricky concept if you don’t remember this rule of thumb: “new minus old over old.” In this case, for the percent increase from 2012 to 2013, we take the “new” value, 5,880, and subtract the “old” value, 5,600. This is 280, which we then divide by the “old” to get .05, which is 5%.
Since the percent increase from 2012 to 2013 was 5%, and this is double the predicted increase from 2013 to 2014, we know that the percent increase from 2013 to 2014 will be half of 5%, or 2.5%.
Then, to calculate the number of subscriptions sold in 2014, we multiply the value in 2013, 5,880, by 2.5%. This yields 147, which means that in 2014, 147 additional subscriptions were sold. So, the total amount of subscriptions sold in 2014 is 5,880 + 147 = 6,027.
3. Analyzing Graphical Data
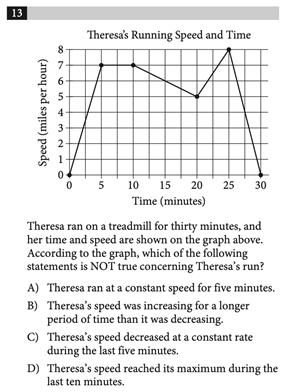
Since we are presented with a graph, let’s make note of what this graph is showing us. On the y-axis we have speed, and on the x-axis we have time. So, this graph is showing us how Theresa’s speed varies with time.
When the graph is flat, the speed is unchanging and is therefore constant. When the graph has a positive slope, the speed is increasing, and when the graph has a negative slope, the speed is decreasing. The rates at which it increases and decreases will be constant since the graph is composed of straight lines (and a line has a constant slope, which means it changes at a constant rate).
For questions asking which statement is not true, it’s crucial to take the time to read through each answer choice. First, choice A states that Theresa ran at a constant speed for five minutes. We can see that this is true, since from 5 to 10 minutes, the graph is flat. Next, choice C says that the speed decreased at a constant rate during the last five minutes. This is also true because from 25 to 30 minutes, the graph is a line with negative slope, which indicates decreasing speed. Finally, choice D claims the maximum speed occurs during the last 10 minutes. We can see that the maximum speed (the highest point on the graph) occurs at 25 minutes, which is within the last 10 minutes, so choice D is also true.
By process of elimination, choice B should be correct, but let’s verify. Choice B states that Theresa’s speed was increasing for a longer time than it was decreasing. Speed was increasing from 0 to 5 and 20 to 25 minutes, for a total of 10 minutes. Speed was decreasing from 10 to 20 and 25 to 30 minutes, for a total of 15 minutes. So, the speed decreased for a longer time than it increased, and choice B is false, making it the correct answer.
4. Inference
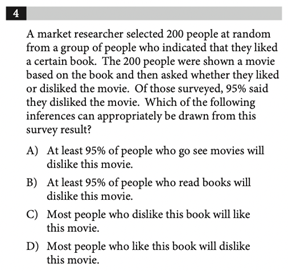
Correct Answer: D
For questions involving surveys, always remember that generalizations can only be made to the specific population studied. For example, if a study is given to a select group of 5th grade math students, when analyzing the results, you can only generalize to 5th grade math students, not all math students or all 5th graders.
In this case, the group surveyed was people who liked the book. From these people, 95% disliked the movie. So, from this survey, most people who like the book will then dislike the movie, which corresponds to choice D.
Choices A and C are incorrect since they generalize to people who see movies and people who dislike the book, which doesn’t apply to the population studied. Choice B is incorrect since it falsely generalizes to all people who read books.
5. Proportions
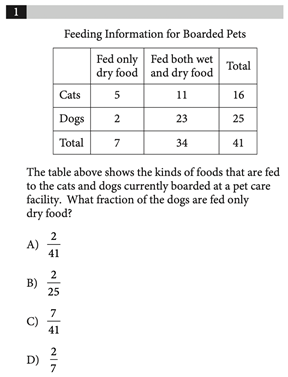
Proportion problems are usually fairly quick, but easy to mess up on if not read carefully. For proportions, the denominator is the total number of things in the group we’re looking at, and the numerator is the specific characteristic we want.
This question asks for the fraction of the dogs that are fed only dry food. So, the group we’re looking at is “dogs” and the characteristic we want is that they “are fed only dry food.”
From the table, the total number of dogs is 25. This means the denominator will be 25. Next, we must find the number of dogs which are also only fed dry food, which is 2, according to the table. So, our numerator is 2, and the answer is 2/25.

Discover your chances at hundreds of schools
Our free chancing engine takes into account your history, background, test scores, and extracurricular activities to show you your real chances of admission—and how to improve them.
6. Scale Factors
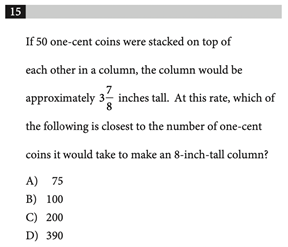
For this question, let’s start with what we know: the column is 8 inches tall. We know that 50 coins creates a \(3\frac{7}{8}\) inch column, which is approximately 4 inches. Since this question asks for an approximation, we know that 8 is slightly more than double \(3\frac{7}{8}\), so we’ll need slightly more than \(50\:\cdot\: 2\) pennies to create an 8-inch column. Answer B is the closest number to our approximate value.
If you wanted to be precise, you could set up an equation:
\(8 in\:\cdot\:\frac{50 coins}{3\frac{7}{8} in}\)
Because 50 coins corresponds to a column which is \(3\frac{7}{8}\) inches tall, we set those two values up in a fraction. We decide which value goes in the numerator and which in the denominator based on the units: since we started with 8 inches, we need the \(3\frac{7}{8}\) inches to be in the denominator so that the inches cancel. Then, we are left with the unit in the numerator, which is coins. The question asks for the number of coins, so this is exactly what we want.
At this point, you would use your calculator to solve the expression, and get about 103 coins. This value is closest to answer choice B.
7. Line of Best Fit/Scatterplots
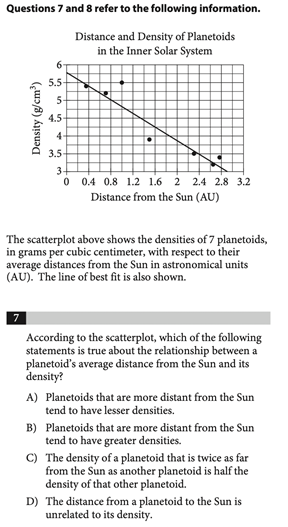
Correct Answer: A
Once again, since we have a graph, let’s take a moment to read the labels. The y-axis shows density and the x-axis shows distance from the sun.
We also see that the line of best fit is sloping downwards. As the distance increases, the density seems to decrease. So, choice A is correct in that larger distances correspond to lesser densities.
Though it wasn’t explicit in this question, an important thing to note about scatterplots is that these relationships show correlation, not causation. Choice C is incorrect because it falsely implies that changes in distance cause changes in density. Choice D is incorrect since though there is no cause and effect relationship, there is a correlation between these two variables.
8. Geometric Applications of Proportions
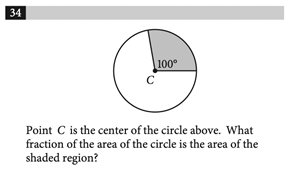
Correct Answer: 5/18, .277, .278
This problem could be confusing in that so little information is given. However, this problem requires that you recall that the proportion of degrees is equivalent to the proportion of area. So, for this problem, all you have to do is divide 100 by 360, which is the total number of degrees in a circle.
Then, the answer is 100/360, or 5/18. If you’re faced with a similar problem on the test, where there is little to no numeric information, try to work with the numbers you do have and find helpful relationships.
9. Unit Conversions
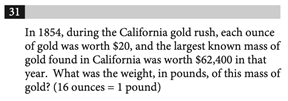
Correct Answer: 195
Unit conversions are fairly simple once you set up the expression correctly. Start with the information given.
For this problem, the price is $62,400, so we will start with this value. Next, we will multiply this value by fractions. Each fraction will consist of a numerator and denominator which are equivalent, so multiplying by these fractions is the same as multiplying by 1. Here is what the expression would look like:
\(\$62,400\:\cdot\:\frac{1 ounce}{\$20}\:\cdot\:\frac{1 pound}{16 ounces}\)
We decide which value to put in the denominator based on the units. In this case, the dollars and the ounces cancel, leaving us with pounds, which is what the question asked for. Solving this expression results in 195 pounds, the answer to the question.
10. Probability
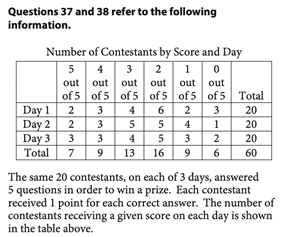
Correct Answer: 5/7, .714
Probability questions are similar to proportion questions in that the denominator should be the group we’re looking at and the numerator should be the characteristic we want.
In this case, it is given that we’re looking at contestants who received a score of 5 on one of the three days, and there is a total of 7 such contestants. The characteristic we want is that the contestant received a score of 5 on Day 2 or Day 3. The number of contestants who fit this description is 2 + 3 = 5, so the probability is 5/7.
For Problem Solving and Data Analysis problems, make sure that your answer addresses what the question asked for. Wrong answer choices on the SAT often reflect common student mistakes, so take the time to read Problem Solving and Data Analysis questions carefully.
When studying for the SAT Math section, try to do plenty of practice problems. The best way to get better at math is to do more math.
Here are some other articles that will help you prepare for the SAT Math section:
- 15 Hardest SAT Math Questions
- 30 SAT Math Formulas You Need to Know
- Guide to SAT Math Heart of Algebra + Practice Questions
- 5 Common SAT Math Mistakes to Avoid
- 5 Tips to Boost Your Math SAT Score
Related CollegeVine Blog Posts

Use generative AI to learn more about data.world
data.world has officially leveled up its integration with Snowflake’s new data quality capabilities
data.world enables trusted conversations with your company’s data and knowledge with the AI Context Engine™
Accelerate adoption of AI with the AI Context Engine™️, now generally available
Why data.world
Unlock an AI-driven future with data.world’s Data Catalog Platform. Enhance data discovery, data governance, and DataOps with a flexible, intuitive platform built for enterprise-wide adoption.
Capabilities
Documentation, common integrations, guidance & articles, reports & tools, upcoming digital event.

Are you ready to revolutionize your data strategy and unlock the full potential of AI in your organization?

We are hiring!
Come join us in our mission to deliver data for all and data for good!
February 9, 2022 — 6 min read
How to write a problem statement for an open data project.

There are literally millions of datasets on the internet that are open and freely available to use. Whatever your focus, with so much data at your fingertips, it can be tempting to utilize these resources to improve your data processing skills, uncover new information, join a data competition, and solve real world problems. But given the sheer volume of data available, where do you start?
When I was first learning how to work with open data, I would often get lost in the possibility of it all. Not only were there seemingly limitless datasets to choose from, the datasets themselves were often large and unexplored.
I would eventually find a dataset that piqued my interest and start “poking” at it. That is, analyzing random questions as they popped into my head, always on the hunt for a result that was interesting. In many data and science spaces, this type of headfirst-diving into analysis without a focused hypothesis driving the exploration is referred to as a “fishing expedition” or “ data dredging ."
While the phrase often has a negative connotation, when done correctly — i.e. using appropriate statistical methods and a large enough sample size — this type of data exploration can be useful for generating hypotheses or reporting on the “state of affairs” in the domain of your data. But if you hope to use an open dataset to solve a problem or make decisions , you’ll want to start your data project with a clearly defined problem statement instead.
Note: The rest of this article will assume that you are developing a problem statement using found data — i.e. freely available data that you did not collect yourself. The overarching process is very similar when developing a problem statement prior to finding available data or collecting yourself, but the order may be slightly different.
What is a problem statement?
In its simplest form, a problem statement defines the pain point you hope to solve or the impact you hope to make with your work. This statement should be clear, concise, and define a measurable outcome.
Ultimately, it should answer the question: “What is the problem that you are trying to solve?”
Creating a problem statement is an iterative process. You may have a potential problem statement in mind right now, but progressing through the following steps may help you refine it as you gather more information. This is by design! Eventually, you’ll end up with a problem statement that is:
- clearly defined
- solving an actual problem that needs solving
- possible to solve with the resources at your disposal
Understanding the domain
No one expects you to be a domain expert in everything, so don’t let your lack of experience in an area dissuade you from trying to solve a problem in that space. That being said, if you are new to a domain area, make sure that you do your research and — ideally — connect with people actually solving problems.
For instance, if you want to solve a problem about homelessness in your city, but you don’t know much about it and have never experienced homelessness yourself, you should look for some insider knowledge before defining your problem statement. You don’t want to repeat work that’s already been done or solve a “problem” that didn’t actually need solving. Folks working at homeless shelters, organizing nonprofits, or otherwise trying to solve similar problems will have a wealth of knowledge and may be able to help make sure you’re embarking on a useful, actionable mission.
Understanding the data
If you clearly define your problem statement and intend to collect the data needed to solve the problem yourself, you could design your data collection methods to perfectly align to your question.
Alternatively, when you’re working with found data, you are limited by the biases, caveats, and data collection methods that the creators employed when the data were collected. That means that if you are defining your problem statement based on an existing dataset, you need to take all of these factors into account.
Some things you’ll want to make sure you understand about your data:
- How can you use the data? (Open data is typically released under a particular license which defines how it can be used and shared. Make sure that you understand your data’s license to ensure you’re using the data correctly. If a license isn’t defined, you aren’t allowed to use the data . For more information on open data licensing, check out our documentation .)
- How was the data collected?
- If your dataset involves people, who was included? And who may have been left out?
- Are there any ethical concerns with using these data?
In data.world , you’ll find additional information about a dataset, as supplied by its collectors in the “About this Dataset” section. Don’t see all the information you need? You can reach out to the dataset creator and other users in the “Discussions” tab of any dataset.
Note: While the above section implies that you may only be using a single dataset to solve a problem, you can incorporate multiple data resources into your project. Just make sure you understand the suggested information about each data resource.
Once you understand the data resources at your disposal, you can assess whether or not they will help you solve your problem.
For instance, if your study into homelessness requires that you understand entrance rates into a homeless shelter every day, but the data you have only consists of weekly admittance rates, you may need to adjust your problem statement. Any mismatches between the needs defined by your problem statement and the available information you can get from your data should be solved by either adjusting your problem statement or finding another data resource.
Creating your own problem statement
Remember, the process of creating your own problem statement is iterative, so you may go through each of the above steps a few times.
But if you make sure to truly understand the pain points in your domain area and what data you have available to you, you’ll be in a great position to create a clear, concise, actionable problem statement.
Looking for more data to help you craft or solve your problem statement? data.world is home to over hundreds of thousands of freely available, open datasets.
Search our archive , sign up for a free account to add your own data, or take advantage of our in-browser SQL query engines, collaborative tools, and more.
And if you want to put your new problem statement skills to work, join TigerGraph’s Graph for All Challenge for an opportunity to uncover solutions to environmental and social global problems and a chance to win some serious prizes! (Click through for details.)
You might also like
- What is Data Discovery?
- What is a data catalog, and how does the modern data catalog empower effective data management?
Check out our other offerings and stay up to date
Catalog & cocktails, a podcast for data people., knowledge hub.
One repository to view all blogposts, webinars, podcasts, tools, ebooks and more
I'd like to receive best practices, insights, upcoming events & learn about data.world products.

IMAGES
VIDEO
COMMENTS
Data analysis is, put simply, the process of discovering useful information by evaluating data. This is done through a process of inspecting, cleaning, transforming, and modeling data using analytical …
To solve those problems, data analysis is very important. Data crunching, business analysis and finding unique insights is a very essential part of management analysis and decision making. There are several tools and …
Check out these insights to uncover ways data can take your problem-solving techniques to the next level, and stay tuned for an upcoming post on the potential power of generative AI in problem-solving.
Data analytics, or data analysis, is the process of screening, cleaning, transforming, and modeling data with the objective of discovering useful information, suggesting conclusions, and supporting problem solving as well …
The Problem Solving and Data Analysis section tests students’ ability to solve real-world problems using mathematical understanding and skills. This includes quantitative …
In its simplest form, a problem statement defines the pain point you hope to solve or the impact you hope to make with your work. This statement should be clear, concise, and define a measurable outcome. Ultimately, it …