

How to Do a T Test in Excel (2 Ways with Interpretation of Results)
Download the Practice Workbook
T Test.xlsx
T Test Types
There are two types of t-tests. They are:
- One-tailed t-test
- Two-tailed t-test
Each of them has 3 subtypes. They are:
- Two sample equal variance
- Two sample unequal variance
How to Do a T-Test in Excel: 2 Effective Ways
Method 1 – using the excel t.test or ttest function for a t-test, case 1.1 – two sample equal variance t-test.
In the dataset, you will see the prices of different laptops and smartphones. Here is a formula that performs a T-Test on the prices of these products and returns the t-test result.
=T.TEST(B5:B14,C5:C14,2,2)
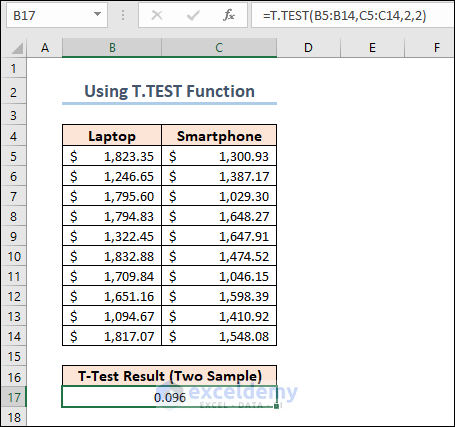
We set the 3rd argument of the function to 2 as we are doing a two-tailed t-test on the dataset. The 4th argument should be 2 for a two-sample equal variance t-test.
Case 1.2 – Paired T-Test
We are going to apply another formula to calculate the Paired T-Test . The following dataset shows the performance mark of some employees in two different criteria.
=T.TEST(C5:C13,D5:D13,2,1)
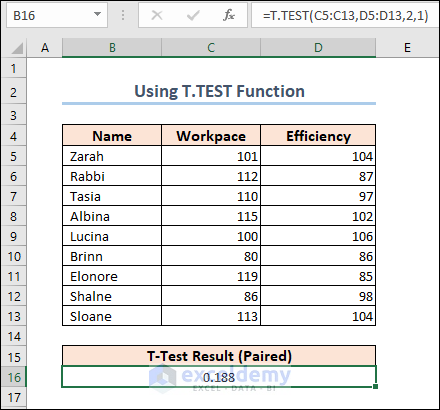
Note: The explanation of the results is described in the following sections.
Method 2 – Using the Analysis ToolPak
- Go to the Options window.
- Select Add-ins and click on the Go button in the Manage section.

- The Add-ins window will appear. Select Analysis ToolPak and click OK again.
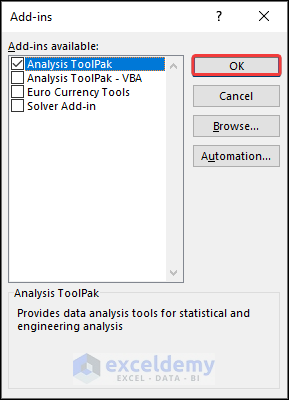
Case 2.1 – Tw-Sample Equal Variance T-Test
- Click on the Data Analysis button from the ribbon of the Data tab.
- The Data Analysis features will appear. Select t-Test: Two Sample Assuming Equal Variances and click OK .
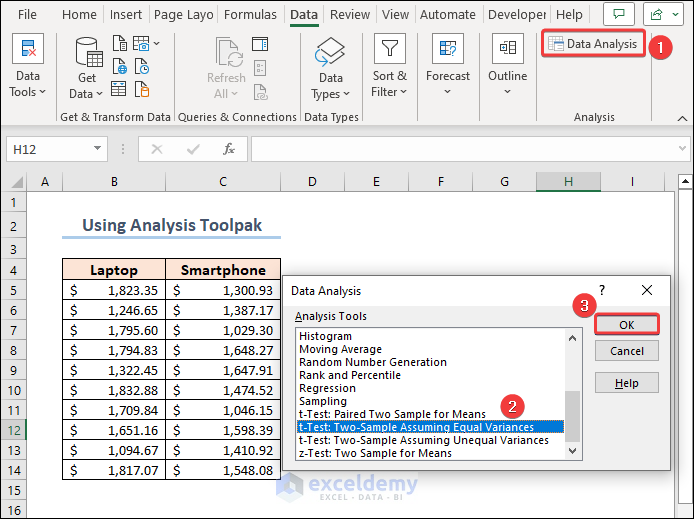
- Set up the parameters for the t-test operation. Insert the Laptop and Smartphone prices as Variable 1 Range and Variable 2 Range. Include the headings in the range and check Labels.
- Set the value of Hypothesized Mean Difference to 0 .
- Select an Output option of your preference and click OK .
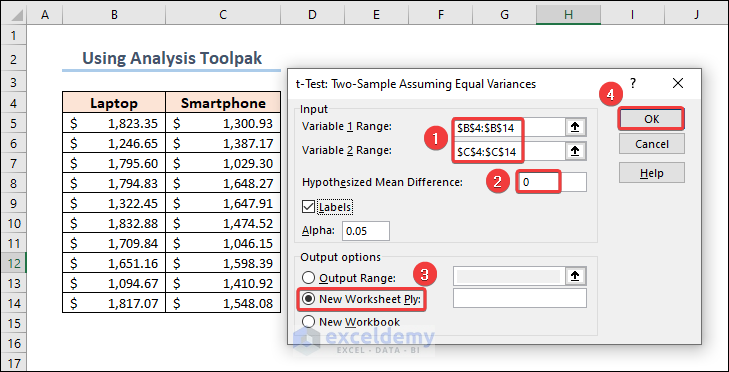
- As we have chosen a New Worksheet for the outputs, we will see the results in a new sheet.
Comments on Results
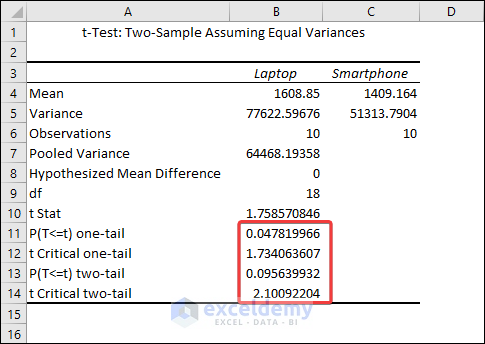
The output shows that the mean values for Laptops and Smartphones are 1608.85 and 1409.164 respectively. We can see from the Variances row that they are not precisely equal, but they are close enough to be assumed to have equal variances. The most relevant metric is the p-value .
The difference between means is statistically significant if the p-value is less than your significance level. Excel calculates p-values for one- and two-tailed T Tests .
One-tailed T Tests can detect only one direction of difference between means. A one-tailed test, for example, might only evaluate whether Smartphones have higher prices than Laptops . Two-tailed tests can reveal differences that are larger or smaller than. There are some other disadvantages to utilizing one-tailed testing, so I’ll continue with the conventional two-tailed results.
For our results, we’ll utilize P(T=t) two-tail, which is the p-value for the t-test’s two-tailed version. We cannot reject the null hypothesis because our p-value ( 0.095639932 ) is greater than the conventional significance level of 0.05 . The hypothesis that the population means differ is supported by our sample data. The mean price of Laptops is greater than the mean price of Smartphones’ .
The Analysis ToolPak also returns results for a one-tailed t-test . Here, the one-tailed P value of the two-sample equal variance t-test is 1.734 .
Case 2.2 – Paired T-Test
Select the t-Test: Paired Two Samples for Mean when you open the Data Analysis window.
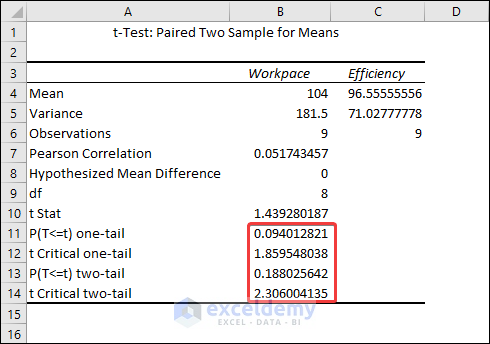
The result shows that the mean for the Workpace is 104 and the mean for the Efficiency is 96.56 .
The difference between means is statistically significant if the p-value is less than your significance level. For our results, we’ll utilize P(T=t) two-tail, which is the p-value for the t-test’s two-tailed version. We cannot reject the null hypothesis because our p-value ( 0.188 ) is greater than the conventional significance level of 0.05 . The hypothesis that the population means differ is supported by our sample data. In particular, the Workpace mean exceeds the Efficiency mean.
How to Interpret T-Test Results in Excel
Let’s bring out the results again.
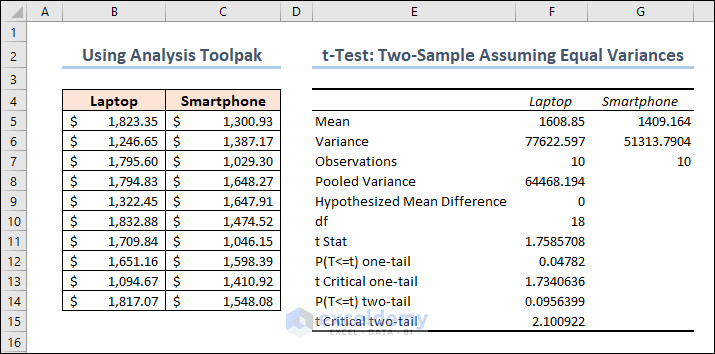
- The mean of laptop prices = 1608.85
- The mean of smartphone prices = 1409.164
ii. Variance
- The variance of laptop prices = 77622.597
- The variance of smartphone prices = 51313.7904
iii. Observations
The number of observations for both laptops and smartphones are 10 .
iv. Pooled Variance
The samples’ average variance, calculated by pooling the variances of each sample.
The mathematical formula for this parameter is:
((No of observations of Sample 1-1)*(Variance of Sample 1) + (No of observations of Sample 2-1)*(Variance of Sample 2))/(No of observations of Sample 1 + No of observations of Sample 2 – 2)
So it becomes: ((10-1)*77622.59676+(10-1)*51313.7904)/(10+10-2) = 64468.19358
v. Hypothesized Mean Difference
We “hypothesize” that the number is the difference between the two population means. In this situation, we chose 0 because we want to see if the difference between the means of the two populations is zero.
It indicates the value of the Degrees of Freedom. Formula for this parameter is:
No of observations of Sample 1 + No of observations of Sample 2 – 2 = 10 + 10 – 2 = 18
vii. t-Stat
The test statistic value of the t-Test operation.
The formula for this parameter is given below.
(Mean of Sample 1 – Mean of Sample 2)/(Square root of (Pooling Variance* (1/No of observations of Sample 1 + 1/No of observations of Sample 2)))
So it becomes: (1608.85 – 1409.164)/Sqrt(64468.19358 * (1/10 + 1/10)) = 1.758570846
viii. P(T<=t) two-tail
A two-tailed t-test’s p-value. This value can be found by entering t = 1.758570846 with 18 degrees of freedom into any T Score to P Value Calculator.
In this situation, the value of p is 0.095639932 . Because this is greater than 0.05 , we cannot reject the null hypothesis. This suggests that we lack adequate evidence to conclude that the two population means differ.
ix. t-Critical two-tail
This is the test’s crucial value. A t-Critical value Calculator with 18 degrees of freedom and a 95% confidence level can be used to calculate this number.
In this instance, the critical value is 2.10092204 . We cannot reject the null hypothesis because our test statistic t is less than this number. Again, we lack adequate information to conclude that the two population means are distinct.
Things to Remember
- Excel demands that your data be arranged in columns, with data from each group in a separate column. The first row should have labels or headers.
- Clearly state your null hypothesis (usually that there is no significant difference between the group means) and your alternative hypothesis (the opposite of the null hypothesis).
- As a result of the t-test, Excel returns the p-value. A small p-value (usually less than the specified alpha level) indicates that the null hypothesis may be rejected and that there is a substantial difference between the group means.
Frequently Asked Questions
Can I perform a t-test on unequal sample sizes in Excel?
Yes, you can use the T.TEST function to do a t-test on unequal sample sizes. When calculating the test statistic, Excel automatically accounts for unequal sample sizes.
What is the difference between a one-tailed and a two-tailed t-test?
A one-tailed t-test determines if the means of the two groups differ substantially in a given direction (e.g., greater or smaller). A two-tailed t-test looks for any significant difference, regardless of direction.
Can I calculate the effect size in Excel for t-tests?
While there is no built-in tool in Excel to calculate effect size, you can manually compute Cohen’s d for independent t-tests and paired sample correlations for paired t-tests using Excel’s basic mathematical operations.
<< Go Back to Excel for Statistics | Learn Excel
What is ExcelDemy?
Tags: Statistical Significance in Excel

Md. Meraz Al Nahian has worked with the ExcelDemy project for over 1.5 years. He wrote 140+ articles for ExcelDemy. He also solved a lot of user problems and worked on dashboards. He is interested in data analysis, advanced Excel, statistics, and dashboards. He also likes to explore various Excel and VBA applications. He completed his graduation in Electrical & Electronic Engineering from Bangladesh University of Engineering & Technology (BUET). He enjoys exploring Excel-related features to gain efficiency... Read Full Bio
Leave a reply Cancel reply
ExcelDemy is a place where you can learn Excel, and get solutions to your Excel & Excel VBA-related problems, Data Analysis with Excel, etc. We provide tips, how to guide, provide online training, and also provide Excel solutions to your business problems.
Contact | Privacy Policy | TOS
- User Reviews
- List of Services
- Service Pricing

- Create Basic Excel Pivot Tables
- Excel Formulas and Functions
- Excel Charts and SmartArt Graphics
- Advanced Excel Training
- Data Analysis Excel for Beginners

Advanced Excel Exercises with Solutions PDF


Dr. Matt C. Howard
My research interests include (1) statistics and methodologies, (2) health and well-being, (3) personality and individual differences, as well as (4) technology-enhanced training and development., how to perform a two-sample t-test in excel.
I often use two-sample t-tests as an introduction to Excel in my undergraduate statistics courses – and sometimes my graduate courses, too. Because the students are still getting used to functions in Excel, they tend to have many difficulties with this lesson. For this reason, I created the page below to provide an easy-to-read guide on performing two-sample t-tests in Excel. As always, if you have any questions, please email me a [email protected] !
Before learning about two-sample t-tests in Excel, we must first know what a two-sample t-test is used for. The textbook definition says that a two-sample t-test is used to “determine whether two sets of data are significantly different from each other”; however, I am not a fan of this definition. Instead, I prefer to say that a two-sample t-test is used to “test whether the means of a measured variable in two groups is significantly different.” So, a two-sample t-test is used to answer questions that are similar to the following:
- In our sample, do women have better test grades than men?
- Are men taller than women?
- Do people in a class taught by Dr. Howard perform better on a test than those in Dr. Smith’s class?
- Do employees in Training Group A have better performance than Training Group B?
Now that we know what a two-sample t-test is used for, we can now calculate a two-sample t-test in Excel! To begin, open your data in Excel. If you don’t have a dataset, download the example dataset here. In the example dataset, we are comparing the test grades of two classes (Dr. Howard and Dr. Smith) to determine which class has higher grades on an exam.
The data should look something like this:

If it doesn’t, that is okay. You can calculate a t-test in Excel fairly easily using many different data formats, but we’ll stick with the format in the picture for simplicity.
Once you have the data open, click on the Data tab at the top. Then click on Data Analysis, as seen below:

Don’t see that tab? If not, go to my page on Activating the Data Analysis Tab. It should appear once you activate it.
Anyways, if it worked, the following window should have appeared. You’ll want to click on t-test: Two-Sample Assuming Unequal Variances, and then press OK – as seen below:

Then, the following window should pop up. On this window, you need to first click on the icon to identify your Variable 1 Range. Then, you need to highlight (click and drag) your data and press the icon again (seen below). This will identify the data representing Group 1 for your t-test, which is Dr. Howard’s exam scores in the current example.

Do the exact same thing but identify the Group 2 data instead, which is Dr. Smith’s exam scores in the current example.

Does your window now look like this?

If so, good! Click “OK,” and let’s see what we get.

Uhh, what does this mean? Well, let’s walk through it.

This is your t-statistic, which is the effect size. It is a standardized estimate of the difference between the two groups. Unless you know a decent amount about statistics, however, it probably doesn’t mean much to you. So, we should look at the p-values instead…but which one?

Excel provides both one-tailed and two-tailed p-values. Two-tailed p-values are more conservative estimates, and I usually use these to determine whether my results are significant. So, let’s see what the two-tailed p-value is:

There it is! From our results, we can identify that…
- The test statistic is: 2.783
- The p value is .015
Because our p-value is less than .05, we can reject the null and assume that a significant difference exists between our groups! Yay!
But how do we know which group performed significantly better? To do this, we have to calculate the means between the two groups. In this example, they were:
- Mean Dr. Howard’s class – 88.5
- Mean Dr. Smith’s class – 75.3
So, because there was a significant difference and Dr. Howard’s class had the higher mean, we know that Dr. Howard’s class performed significantly better on the exam than Dr. Smith’s class.
We did it! We calculated everything that we needed to know about the t-test! Good work!
Do you still have any questions? Or comments about this guide? Feel free to email me at [email protected] . I am always happy to chat!
Share this:

- Already have a WordPress.com account? Log in now.
- Subscribe Subscribed
- Copy shortlink
- Report this content
- View post in Reader
- Manage subscriptions
- Collapse this bar
#1 Excel tutorial on the net
This example teaches you how to perform a t-Test in Excel . The t-Test is used to test the null hypothesis that the means of two populations are equal.
Below you can find the study hours of 6 female students and 5 male students.

To perform a t-Test, execute the following steps.
1. First, perform an F-Test to determine if the variances of the two populations are equal. This is not the case.
2. On the Data tab, in the Analysis group, click Data Analysis.

Note: can't find the Data Analysis button? Click here to load the Analysis ToolPak add-in .
3. Select t-Test: Two-Sample Assuming Unequal Variances and click OK.

4. Click in the Variable 1 Range box and select the range A2:A7.
5. Click in the Variable 2 Range box and select the range B2:B6.
6. Click in the Hypothesized Mean Difference box and type 0 (H 0 : μ 1 - μ 2 = 0).
7. Click in the Output Range box and select cell E1.

8. Click OK.

Conclusion: We do a two-tail test (inequality). lf t Stat < -t Critical two-tail or t Stat > t Critical two-tail, we reject the null hypothesis. This is not the case, -2.365 < 1.473 < 2.365. Therefore, we do not reject the null hypothesis. The observed difference between the sample means (33 - 24.8) is not convincing enough to say that the average number of study hours between female and male students differ significantly.
- Analysis ToolPak
Learn more, it's easy
- Descriptive Statistics
- Moving Average
- Exponential Smoothing
- Correlation
Download Excel File
- t-test.xlsx
Next Chapter
- Create a Macro

Follow Excel Easy
Become an Excel Pro
- 300 Examples
t-Test • © 2010-2024 Excel is Awesome, we'll show you: Introduction • Basics • Functions • Data Analysis • VBA
How to Conduct a Two Sample t-Test in Excel
A two sample t-test is used to test whether or not the means of two populations are equal.
This tutorial explains how to conduct a two sample t-test in Excel.
Suppose researchers want to know whether or not two different species of plants in a particular country have the same mean height. Because it would take too long to go around and measure every single plant, they decide to collect a sample of 20 plants from each species.
The following image shows the height (in inches) for each plant in each sample:

We can conduct a two sample t-test to determine if the two species have the same mean height using the following steps:
Step 1: Determine if the population variances are equal .
When we conduct a two sample t-test, we must first decide if we will assume that the two populations have equal or unequal variances. As a rule of thumb, we can assume the populations have equal variances if the ratio of the larger sample variance to the smaller sample variance is less than 4:1.
We can find the variance for each sample using the Excel function =VAR.S(Cell range) , as the following image shows:

The ratio of the larger sample variance to the smaller sample variance is 12.9053 / 8.1342 = 1.586 , which is less than 4. This means we can assume that the population variances are equal.
Step 2: Open the Analysis ToolPak .
On the Data tab along the top ribbon, click “Data Analysis.”

If you don’t see this as an option to click on, you need to first download the Analysis ToolPak , which is completely free.
Step 3: Select the appropriate test to use.
Select the option that says t-Test: Two-Sample Assuming Equal Variances and then click OK.

Step 4: Enter the necessary info .
Enter the range of values for Variable 1 (our first sample), Variable 2 (our second sample), the hypothesized mean difference (in this case we put “0” because we want to know if the true mean population difference is 0), and the output range where we would like to see the results of the t-test displayed. Then, click OK.

Step 5: Interpret the results .
Once you click OK in the previous step, the results of the t-test will be displayed.

Here is how to interpret the results:
Mean: This is the mean for each sample. Sample 1 has a mean height of 15.15 and sample 2 has a mean height of 15.8 .
Variance: This is the variance for each sample. Sample 1 has a variance of 8.13 and sample 2 has a variance of 12.90 .
Observations: This is the number of observations in each sample. Both samples have 20 observations (e.g. 20 individual plants in each sample).
Pooled Variance: A number that is calculated by “pooling” the variances of each sample together using the formula s 2 p = [ (n 1 -1)s 2 1 + (n 2 -1)s 2 2 ] / (n 1 +n 2 -2), which turns out to be 10.51974 . This number is later used when calculating the test statistic t .
Hypothesized mean difference: The number that we “hypothesize” is the difference between the two population means. In this case, we chose 0 because we want to test whether or not the difference between the two populations means is 0, e.g. there is no difference.
df: The degrees of freedom for the t-test, calculated as n 1 + n 2 -2 = 20 + 20 – 2 = 38 .
t Stat: The test statistic t , calculated as t = [ x 1 – x 2 ] / √ [ s 2 p (1/n 1 + 1/n 2 ) ]
In this case, t = [15.15-15.8] / √ [ 10.51974(1/20+1/20) ] = -0.63374 .
P(TThe p-value for a two-tailed t-test. In this case, p = 0.530047 . This is much larger than alpha = 0.05, so we fail to reject the null hypothesis. We do not have sufficient evidence to say that the two population means are different.
t Critical two-tail: This is the critical value of the test, found by identifying the value in the t Distribution table that corresponds with a two-tailed test with alpha = 0.05 and df = 38. This turns out to be 2.024394 . Since our test statistic t is less than this value, we fail to reject the null hypothesis. We do not have sufficient evidence to say that the two population means are different.
Note that the p-value and the critical value approach will both lead to the same conclusion.
Additional Resources
The following tutorials explain how to perform other types of t-tests in Excel:
How to Conduct a One Sample t-Test in Excel How to Conduct a Paired Samples t-Test in Excel
A Simple Explanation of Internal Consistency
How to perform simple linear regression in stata, related posts, how to create a stem-and-leaf plot in spss, how to create a correlation matrix in spss, how to convert date of birth to age..., excel: how to highlight entire row based on..., how to add target line to graph in..., excel: how to use if function with negative..., excel: how to use if function with text..., excel: how to use greater than or equal..., excel: how to use if function with multiple..., pandas: how to rename only the last column....
- Skip to secondary menu
- Skip to main content
- Skip to primary sidebar
Statistics By Jim
Making statistics intuitive
How to Test Variances in Excel
By Jim Frost 7 Comments
Use a variances test to determine whether the variability of two groups differs. In this post, we’ll work through a two-sample variances test that Excel provides. Even if Excel isn’t your primary statistical software, this post provides an excellent introduction to variance tests. Excel refers to this analysis as F-Test Two-Sample for Variances.

In this post, I provide step-by-step instructions for using Excel to conduct a two-sample variance test and interpreting the statistical results. I also include links to supplementary information I’ve written.
Before proceeding, ensure that Excel’s Data Analysis ToolPak is installed for Excel. Look for Data Analysis as shown below.

If you don’t see Data Analysis, you’ll have to install that ToolPak. Learn how to install it in my post about using Excel to perform t-tests . It’s free!
F-test for Two-Sample Variances in Excel
In general, variances tests assess the variability of the data in multiple groups to determine whether they are different. Variance is a measure of variability that uses squared units, which makes it hard for us humans to interpret. However, various statistical procedures include variances in their calculations. The standard deviation is a more common measure of variability, and it is simply the square root of the variance. Standard deviations are much easier to interpret because they use the same units as the original data.
Analysts frequently use F-tests to assess the differences between group means in analysis of variance (ANOVA) . However, F-tests are very flexible tests that evaluate the ratio of two variances. By changing the variances in the numerator and denominator, analysts can use F-tests to assess a diverse array of properties, such as the overall statistical significance of a regression model to the differences between group means. For variance tests, we’ll use the F-test to determine whether two variances are different.
Excel can perform only two-sample variance tests, which assesses variances for precisely two groups. However, other types of tests can compare variability for more groups.
Typically, you perform this hypothesis test to determine whether two population variances are different. This form of the test uses independent samples. In other words, each group contains different people or items.
From Excel’s Data Analysis popup, choose F-test Two-Sample for Variances .

Related post : Measures of Variability
Hypotheses in Variances Tests
The standard two-tailed two-sample variance tests use the following hypotheses:
- Null : The two population variances are equal.
- Alternative : The two population variances are not equal.
If the p-value is less than your significance level (e.g., 0.05), you can reject the null hypothesis. The difference between the two variances is statistically significant. This condition indicates that your sample provides strong enough evidence to conclude that the variability in the two populations are different. In other words, their spreads differ. Hypothesis tests, like variance tests, allow you to use samples to draw conclusions about populations.
Unfortunately, Excel provides a p-value for only the one-tailed form of the variances test. One-tailed tests can detect differences between means in only one direction. For example, a one-tailed test might determine only whether Group A’s variability is greater than Group B’s variability. Two-tailed tests can detect differences in either direction—greater than or less than. There are additional drawbacks to using one-tailed tests. I wish Excel provided both one-tailed and two-tailed results as it does with two-sample t-tests.
Related posts : Hypothesis Testing Overview and One and Two-Tailed Hypothesis Tests
Performing the Two-Sample Variances Test in Excel
For this example, I’ll use data from my blog post about a Mythbusters’ Battle of the Sexes episode . In that episode, the Mythbusters evaluate whether men or women are better at parallel parking.
The Mythbusters have ten subjects per group and use a parking test that produces scores between 0 and 100. The mean difference between men and women is not statistically significant.
However, while testing the subjects, the hosts noticed that the women’s parallel parking skills appear to be more variable than the men’s abilities. The graph below shows how women have a broader range of scores than men.

While the spread of these two groups looks very different, let’s use Excel’s variances test to determine whether this difference is statistically significant.
To perform a two-sample variance test in Excel, arrange your data in two columns, as shown below. Download the CSV file that contains the data for this example: VariancesTest .

- In Excel, click Data Analysis on the Data tab.
- From the Data Analysis popup, choose F-Test Two-Sample for Variances .
- Under Input , select the ranges for both Variable 1 Range and Variable 2 Range .
- Check the Labels checkbox if you have meaningful variable names in row 1. This option makes the output easier to interpret. Ensure that you include the label row in step #3.
- Excel uses the default Alpha value of 0.05, which you usually won’t need to change. Alpha is also known as the significance level.
For this example, the popup should look like the following:

After Excel creates the statistical output, I autofit column A to display all of it.
Interpreting the Test Results

The output indicates that the variance for Males is 131.3778, and for Females it is 982.2778. The difference between these numerical measures of variances corresponds to the difference we observed in the graph. The p-value is the most important statistic. If you want to learn about the other statistics , read my posts about F (i.e., the F-value) , df (degrees of freedom) , and critical values .
For our results, we’ll use the P(F<=f) one-tail row, which is the p-value for the one-tailed form of the variances test. Because our p-value (0.003094) is less than the standard significance level of 0.05, we can reject the null hypothesis. Our sample data support the hypothesis that the population variances are different. Women are more variable at parallel parking than men.
What Excel’s Variances Test Does Not Include
Excel’s only variances test is the F-test. F-tests can assess only two groups and are susceptible to departures from normality . However, other two-sample tests are less sensitive to departures from normality, such as Bonett’s and Levene’s tests. Levene’s test is particularly suitable for small samples (>20) and skewed data.
If you have more than two groups, use Bartlett’s or Levene’s test to evaluate their variances. Bartlett’s test is more sensitive to the normality assumption than Levene’s test.
As I mentioned earlier, Excel, strangely, only offers the one-tailed test result, which is often inappropriate.
Finally, it would be nice if Excel converted the variances to standard deviations and displayed confidence intervals. The variances that Excel displays are not intuitive. Additionally, they are only the point estimates from the samples. Confidence intervals help you determine a range of values that the population parameter is like to fall within.
Share this:

Reader Interactions
May 10, 2021 at 9:38 pm
It appears that Excel 2016 calculates the F test for two tails.
April 19, 2021 at 2:22 pm
Thank you for your explanation of Excel’s F-test for equal variances. However, there is an issue with Excel’s calculation that I was recently made aware of by one of my students. If you note in your results table, the observed F-value (0.13) is smaller than the critical F-value (0.31), but the p-value is quite small (0.003).
Excel recommends that the group with the larger variance be selected as the first group (or first column) and the other group with smaller variance selected as the second column data. This would provide F-calculations that are more consistent with p-values.
April 19, 2021 at 3:40 pm
February 28, 2021 at 3:13 pm
Thank you for some fantastic books, introducing myself and others to the magical world of statistics!
I have a question that I hope you can help me with. The statistical software I use, do not have a function for Bonett Hypothesis test, why I thought I would create one. So far, I’ve done the calculations for the confidence interval and they are spot on (when I use the data you provide in your hypothesis book at page 238 and compare the Bonett confidence interval-result to my own).
However, I can’t seem to figure out how to calculate the p-value. I’ve found documentation at minitab.coms webpage, https://support.minitab.com/en-us/minitab/20/help-and-how-to/statistics/basic-statistics/how-to/1-variance/methods-and-formulas/methods-and-formulas/#hypothesis-test-for-the-chi-square-method , for how to calculate the p-value, but I’m still unsure how it is done, since the equation to solve for alpha contains inverse cumulative probability.
Can you help me out here?
Thanks in advance and thank you for some really good books!
November 24, 2019 at 1:23 am
I liked it very much
November 19, 2019 at 5:48 pm
Valuable informations
November 18, 2019 at 3:51 am
very interesting and important
Comments and Questions Cancel reply
Hypothesis Test in Excel for the Population Mean (Large Sample)
Microsoft Excel for statistics > Hypothesis Test in Excel #1
Note : This article covers z-tests in Excel. If you have a small sample (under 30), or don’t know the population standard deviation , run a T Test in Excel instead.
Hypothesis Test in Excel: Overview

Hypothesis Test in Excel: Two Sample for Means
Hypothesis test in excel: manual steps.
Step 1: Type your data into a single column in Excel. For example, type your data into cells A1:A40.
Step 2: Click the “Data” tab and then click “Data Analysis.” If you don’t see the Data Analysis button then you may need to load the Data Analysis Toolpak .
Step 3: Click “ Descriptive Statistics “ and then click “OK.” When the Descriptive Statistics dialog box opens, click “Summary Statistics” and then type the location for a cell where you want your result to appear. For example, type”B1.”
Step 4: Click “OK. ” A variety of descriptive statistics, like the median and mode , will appear starting in cell B1.
Step 5: Find the cells that have the mean and the standard error results in it. If you typed in cell B1 in Step 3, your mean will be in cell C3 and your standard error will be in cell C4. Take a note of those cell locations.
Step 6: Type the following formula into cell D1 (assuming your mean is in cell C3 and your SE is in cell C4 — if they are not, you’ll need to adjust the formula): (C3-0)/C4
Change the “zero” to reflect the mean in your null hypothesis . For example, if your null hypothesis states that the mean is $7 per hour, then change the 0 to “7.”
Step 7: Press “Enter” to get the value of the test statistic. Compare the value to the accepted value for your mean from the z-table*. If the test statistic falls into the accepted range, then you will fail to reject the null hypothesis .
Subscribe to our YouTube channel for more Microsoft Excel for Statistics help and tips!
Comments are closed.

IMAGES
COMMENTS
If you don't see this as an option to click on, you need to first download the Analysis ToolPak, which is completely free. Step 3: Select the appropriate test to use. Select the option that says t-Test: Two-Sample Assuming Equal Variances and then click OK. Step 4: Enter the necessary info.
To test this, they collect a random sample of 20 plants from each species and measure their heights. The researchers would write the hypotheses for this particular two sample t-test as follows: H0: µ1 = µ2. HA: µ1 ≠ µ2. Refer to this tutorial for a step-by-step explanation of how to perform this hypothesis test in Excel.
To perform a paired t-test in Excel, arrange your data into two columns so that each row represents one person or item, as shown below. Note that the analysis does not use the subject's ID number. In Excel, click Data Analysis on the Data tab. From the Data Analysis popup, choose t-Test: Paired Two Sample for Means.
Select t-Test: Two Sample Assuming Equal Variances and click OK. Set up the parameters for the t-test operation. Insert the Laptop and Smartphone prices as Variable 1 Range and Variable 2 Range. Include the headings in the range and check Labels. Set the value of Hypothesized Mean Difference to 0.
It should appear once you activate it. Anyways, if it worked, the following window should have appeared. You'll want to click on t-test: Two-Sample Assuming Unequal Variances, and then press OK - as seen below: Then, the following window should pop up. On this window, you need to first click on the icon to identify your Variable 1 Range.
To test this, they collect a random sample of 20 plants from each species and measure their heights. The researchers would write the hypotheses for this particular two sample t-test as follows: H0: µ1 = µ2. HA: µ1 ≠ µ2. Refer to this tutorial for a step-by-step explanation of how to perform this hypothesis test in Excel.
The researchers would write of hypotheken for diese particular two sampler t-test how tracks: H 0: µ 1 = µ 2; H A: µ 1 ≠ µ 2; Refer to this tutorial to a step-by-step explanation of how to perform this hypothesis test included Excel. Example 3: Paired Samples t-test in Excel. A paired samples t-test is used to compare the means from two ...
This video explains on how to use Microsoft Excel for Two Sample Hypothesis Test. Both the independent and dependent (paired) groups are covered in this video
Welcome to this tutorial on how to test a hypothesis using the two-sample t-test using the Excel data analysis tool. In this video, we will walk you through ...
On the Data tab along the top ribbon, click "Data Analysis.". If you don't see this as an option to click on, you need to first download the Analysis ToolPak, which is completely free. Step 2: Select the appropriate test to use. Select the option that says t-Test: Paired Two Sample for Means and then click OK.
Please SUBSCRIBE:https://www.youtube.com/subscription_center?add_user=mjmacartyhypothesis testing in Excelhttps://alphabench.com/data/t-test-tutorial.htmlDow...
Excel: Start by entering the data in two columns in the same order that they appear in the problem. Then select Data > Data Analysis > t-test: Paired Two Sample for Means, then select OK. Select the Before data (including the label) into the Variable 1 Range, and the After data (including the label) in the Variable 2 Range.
For a 2-sample t-test, the signal, or effect, is the difference between the two sample means. This calculation is straightforward. If the first sample mean is 20 and the second mean is 15, the effect is 5. Typically, the null hypothesis states that there is no difference between the two samples.
To perform a two sample z-test to determine if the mean IQ level is different between the two cities, click the Data tab along the top ribbon, then click the Data Analysis button within the Analysis group. If you don't see Data Analysis as an option, you need to first load the Analysis ToolPak in Excel. Once you click this button, select z ...
In this guide, we'll delve into the process of hypothesis testing using Excel, specifically focusing on a t-test for comparing means. Example Scenario: Let's consider a scenario where we have ...
This example teaches you how to perform a t-Test in Excel. The t-Test is used to test the null hypothesis that the means of two populations are equal. Below you can find the study hours of 6 female students and 5 male students. H 0: μ 1 - μ 2 = 0 H 1: μ 1 - μ 2 ≠ 0
On the Data tab along the top ribbon, click "Data Analysis.". If you don't see this as an option to click on, you need to first download the Analysis ToolPak, which is completely free. Step 3: Select the appropriate test to use. Select the option that says t-Test: Two-Sample Assuming Equal Variances and then click OK.
Two group hypothesis tests using Excel T.TEST 24 Other Options In testing sample statistics from two groups for statistical significance, Excel provides two other methods: • the t-test command in the Data Analysis Toolpak, and • combinations of basic Excel Functions.
How to get the Data Analysis button in Excel:https://youtu.be/CNMfY21PXL0Hypothesis Testing Lectures:Part 1: https://youtu.be/cjJGVmQ1lYwPart 2: https://yout...
Two group hypothesis tests using Excel 2013 T-TEST command 4 Approach Excel's two-population T-Test command requires that the data be "stacked" (separated into two groups) by the value of the predictor. Predictor must be binary. If the binary predictor is the answer to Q1, then the entire data set must be sorted by Q1.
In Excel, click Data Analysis on the Data tab. From the Data Analysis popup, choose F-Test Two-Sample for Variances. Under Input, select the ranges for both Variable 1 Range and Variable 2 Range. Check the Labels checkbox if you have meaningful variable names in row 1. This option makes the output easier to interpret.
Excel Function: Excel provides the function T.TEST to handle the various two-sample t-tests. T.TEST(R1, R2, tails, type) = the p-value of the t-test for the difference between the population means based on samples R1 and R2, where tails= 1 (one-tailed) or 2 (two-tailed) and typetakes one of the following values: the samples have paired values ...
You have a couple of choices for hypothesis testing in Excel using z-scores: using the Data Analysis Toolpak or you can manually calculate the z-score. Hypothesis Test in Excel: Two Sample for Means . Hypothesis Test in Excel: Manual Steps. Step 1: Type your data into a single column in Excel. For example, type your data into cells A1:A40. Step ...