
Statistics Made Easy

How to Perform One Sample & Two Sample Z-Tests in Excel
A one sample z-test is used to test whether a population mean is significantly different than some hypothesized value.
A two sample z-test is used to test whether two population means are significantly different from each other.
The following examples show how to perform each type of test in Excel.
Example 1: One Sample Z-Test in Excel
Suppose the IQ in a population is normally distributed with a mean of μ = 100 and standard deviation of σ = 15.
A scientist wants to know if a new medication affects IQ levels, so she recruits 20 patients to use it for one month and records their IQ levels at the end of the month.
We can use the following formula in Excel to perform a one sample z-test to determine if the new medication causes a significant difference in IQ levels:
The following screenshot shows how to use this formula in practice:

The one-tailed p-value is 0.181587 . Since we’re performing a two-tailed test, we can multiply this value by 2 to get p = 0.363174 .
Since this p-value is not less than .05, we do not have sufficient evidence to reject the null hypothesis.
Thus, we conclude that the new medication does not significantly affect IQ level.
Example 2: Two Sample Z-Test in Excel
Suppose the IQ levels among individuals in two different cities are known to be normally distributed each with population standard deviations of 15.
A scientist wants to know if the mean IQ level between individuals in city A and city B are different, so she selects a simple random sample of 20 individuals from each city and records their IQ levels.
The following screenshot shows the IQ levels for the individuals in each sample:

To perform a two sample z-test to determine if the mean IQ level is different between the two cities, click the Data tab along the top ribbon, then click the Data Analysis button within the Analysis group.

If you don’t see Data Analysis as an option, you need to first load the Analysis ToolPak in Excel.
Once you click this button, select z-Test: Two Sample for Means in the new window that appears:

Once you click OK , you can fill in the following information:

Once you click OK , the results will appear in cell E1:

The test statistic for the two sample z-test is -1.71817 and the corresponding p-value is .085765.
Thus, we conclude that the mean IQ level is not significantly different between the two cities.
Additional Resources
The following tutorials explain how to perform other common statistical tests in Excel:
How to Conduct a One Sample t-Test in Excel How to Conduct a Two Sample t-Test in Excel How to Conduct a Paired Samples t-Test in Excel How to Perform Welch’s t-Test in Excel
Featured Posts

Hey there. My name is Zach Bobbitt. I have a Masters of Science degree in Applied Statistics and I’ve worked on machine learning algorithms for professional businesses in both healthcare and retail. I’m passionate about statistics, machine learning, and data visualization and I created Statology to be a resource for both students and teachers alike. My goal with this site is to help you learn statistics through using simple terms, plenty of real-world examples, and helpful illustrations.
2 Replies to “How to Perform One Sample & Two Sample Z-Tests in Excel”
hi why not using a t test here? what ‘s the difference between these examples and t test examples? just because an IQ test is an standardized test with the mean of 0 and SD or 1?
Hi Zach, I’s so glad I found your website. You are doing a wonderful job helping students like me. I’m surprised no one is leaving comments. You simplify the process of statistics so well that even I who is “maths dumb” can grasp it. One thing though, in the first example of one sample z-test, you multiplied by 2 instead of one, why is that?
Leave a Reply Cancel reply
Your email address will not be published. Required fields are marked *
Join the Statology Community
Sign up to receive Statology's exclusive study resource: 100 practice problems with step-by-step solutions. Plus, get our latest insights, tutorials, and data analysis tips straight to your inbox!
By subscribing you accept Statology's Privacy Policy.

Z.TEST function
This article describes the formula syntax and usage of the Z.TEST function in Microsoft Excel.
Returns the one-tailed P-value of a z-test.
For a given hypothesized population mean, x, Z.TEST returns the probability that the sample mean would be greater than the average of observations in the data set (array) — that is, the observed sample mean.
To see how Z.TEST can be used in a formula to compute a two-tailed probability value, see the Remarks section below.
Z.TEST(array,x,[sigma])
The Z.TEST function syntax has the following arguments:
Array Required. The array or range of data against which to test x.
x Required. The value to test.
Sigma Optional. The population (known) standard deviation. If omitted, the sample standard deviation is used.
If array is empty, Z.TEST returns the #N/A error value.
Z.TEST is calculated as follows when sigma is not omitted:
Z.TEST( array,x,sigma ) = 1- Norm.S.Dist ((Average(array)- x) / (sigma/√n),TRUE)
or when sigma is omitted:
Z.TEST( array,x ) = 1- Norm.S.Dist ((Average(array)- x) / (STDEV(array)/√n),TRUE)
where x is the sample mean AVERAGE(array), and n is COUNT(array).
Z.TEST represents the probability that the sample mean would be greater than the observed value AVERAGE(array), when the underlying population mean is μ0. From the symmetry of the Normal distribution, if AVERAGE(array) < x, Z.TEST will return a value greater than 0.5.
The following Excel formula can be used to calculate the two-tailed probability that the sample mean would be further from x (in either direction) than AVERAGE(array), when the underlying population mean is x:
=2 * MIN(Z.TEST(array,x,sigma), 1 - Z.TEST(array,x,sigma)).
Copy the example data in the following table, and paste it in cell A1 of a new Excel worksheet. For formulas to show results, select them, press F2, and then press Enter. If you need to, you can adjust the column widths to see all the data.

Need more help?
Want more options.
Explore subscription benefits, browse training courses, learn how to secure your device, and more.

Microsoft 365 subscription benefits

Microsoft 365 training

Microsoft security

Accessibility center
Communities help you ask and answer questions, give feedback, and hear from experts with rich knowledge.

Ask the Microsoft Community

Microsoft Tech Community

Windows Insiders
Microsoft 365 Insiders
Was this information helpful?
Thank you for your feedback.
How to Do Hypothesis Tests With the Z.TEST Function in Excel
- Statistics Tutorials
- Probability & Games
- Descriptive Statistics
- Inferential Statistics
- Applications Of Statistics
- Math Tutorials
- Pre Algebra & Algebra
- Exponential Decay
- Worksheets By Grade
- Ph.D., Mathematics, Purdue University
- M.S., Mathematics, Purdue University
- B.A., Mathematics, Physics, and Chemistry, Anderson University
Hypothesis tests are one of the major topics in the area of inferential statistics. There are multiple steps to conduct a hypothesis test and many of these require statistical calculations. Statistical software, such as Excel, can be used to perform hypothesis tests. We will see how the Excel function Z.TEST tests hypotheses about an unknown population mean.
Conditions and Assumptions
We begin by stating the assumptions and conditions for this type of hypothesis test. For inference about the mean we must have the following simple conditions:
- The sample is a simple random sample .
- The sample is small in size relative to the population . Typically this means that the population size is more than 20 times the size of the sample.
- The variable being studied is normally distributed.
- The population standard deviation is known.
- The population mean is unknown.
All of these conditions are unlikely to be met in practice. However, these simple conditions and the corresponding hypothesis test are sometimes encountered early in a statistics class. After learning the process of a hypothesis test, these conditions are relaxed in order to work in a more realistic setting.
Structure of the Hypothesis Test
The particular hypothesis test we consider has the following form:
- State the null and alternative hypotheses .
- Calculate the test statistic, which is a z -score.
- Calculate the p-value by using the normal distribution. In this case the p-value is the probability of obtaining at least as extreme as the observed test statistic, assuming the null hypothesis is true.
- Compare the p-value with the level of significance to determine whether to reject or fail to reject the null hypothesis.
We see that steps two and three are computationally intensive compared two steps one and four. The Z.TEST function will perform these calculations for us.
Z.TEST Function
The Z.TEST function does all of the calculations from steps two and three above. It does a majority of the number crunching for our test and returns a p-value. There are three arguments to enter into the function, each of which is separated by a comma. The following explains the three types of arguments for this function.
- The first argument for this function is an array of sample data. We must enter a range of cells that corresponds to the location of the sample data in our spreadsheet.
- The second argument is the value of μ that we are testing in our hypotheses. So if our null hypothesis is H 0 : μ = 5, then we would enter a 5 for the second argument.
- The third argument is the value of the known population standard deviation. Excel treats this as an optional argument
Notes and Warnings
There are a few things that should be noted about this function:
- The p-value that is output from the function is one-sided. If we are conducting a two-sided test, then this value must be doubled.
- The one-sided p-value output from the function assumes that the sample mean is greater than the value of μ we are testing against. If the sample mean is less than the value of the second argument, then we must subtract the output of the function from 1 to get the true p-value of our test.
- The final argument for the population standard deviation is optional. If this is not entered, then this value is automatically replaced in Excel’s calculations by the sample standard deviation. When this is done, theoretically a t-test should be used instead.
We suppose that the following data are from a simple random sample of a normally distributed population of unknown mean and standard deviation of 3:
1, 2, 3, 3, 4, 4, 8, 10, 12
With a 10% level of significance we wish to test the hypothesis that the sample data are from a population with mean greater than 5. More formally, we have the following hypotheses:
- H 0 : μ= 5
- H a : μ > 5
We use Z.TEST in Excel to find the p-value for this hypothesis test.
- Enter the data into a column in Excel. Suppose this is from cell A1 to A9
- Into another cell enter =Z.TEST(A1:A9,5,3)
- The result is 0.41207.
- Since our p-value exceeds 10%, we fail to reject the null hypothesis.
The Z.TEST function can be used for lower tailed tests and two tailed tests as well. However the result is not as automatic as it was in this case. Please see here for other examples of using this function.
- What Is a P-Value?
- Example of Two Sample T Test and Confidence Interval
- Hypothesis Test Example
- Hypothesis Test for the Difference of Two Population Proportions
- An Example of a Hypothesis Test
- Functions with the T-Distribution in Excel
- The Runs Test for Random Sequences
- How to Conduct a Hypothesis Test
- Chi-Square Goodness of Fit Test
- How to Use the NORM.INV Function in Excel
- What Is the Difference Between Alpha and P-Values?
- What Level of Alpha Determines Statistical Significance?
- How to Find Degrees of Freedom in Statistics
- Robustness in Statistics
- Example of a Chi-Square Goodness of Fit Test
- Calculating a Confidence Interval for a Mean

Z.TEST: Excel Formula Explained
Introduction.
If you are familiar with statistical analysis and have worked with Excel, you may have come across the Z.TEST formula. This is a powerful statistical tool that Excel provides for testing hypotheses, particularly related to population means. In this blog post, we will explore what Z.TEST is and why it is important in statistical analysis.
A. Brief Explanation of What Z.TEST Is
The Z.TEST formula in Excel is a statistical function that is used to test the null hypothesis that the mean of a population is equal to a specified value. It compares a sample mean to a hypothesized population mean, and returns a p-value that indicates the likelihood of observing the sample mean if the null hypothesis were true. Essentially, it helps us determine whether a sample mean is significantly different from a population mean, based on a chosen level of significance.
- The syntax for the Z.TEST formula is: =Z.TEST(array, value, [sigma][sigma] is an optional argument for the population standard deviation; if omitted, Excel will use the sample standard deviation
B. Importance of Z.TEST in Statistical Analysis
Z.TEST is a critical tool in statistical analysis, particularly when we are testing hypotheses about population means. It allows us to determine whether the difference between a sample mean and a hypothesized population mean is statistically significant, which can be useful in a variety of contexts such as:
- A/B testing for website design or marketing campaigns
- Comparing the effectiveness of different treatments or medications
- Analyzing survey data for customer satisfaction or opinion polls
Without the Z.TEST formula, it would be difficult to confidently draw conclusions about population means based on sample data alone. By using this formula, we can make more informed decisions and have greater confidence in the results of our analyses.
Key Takeaways
- Z.TEST is a statistical function in Excel that is used to test the null hypothesis that the mean of a population is equal to a specified value.
- The formula compares a sample mean to a hypothesized population mean and returns a p-value that indicates the likelihood of observing the sample mean if the null hypothesis were true.
- Z.TEST is important in statistical analysis because it allows us to determine whether the difference between a sample mean and a hypothesized population mean is statistically significant, which can be useful in a variety of contexts.
- Some examples of when Z.TEST is useful include A/B testing, comparing treatments or medications, and analyzing survey data.
- Using the Z.TEST formula can help us make more informed decisions and have greater confidence in the results of our analyses.
What is Z.TEST?
If you work with data in Excel, you might have come across functions like AVERAGE, COUNT, and SUM. These are some of the most commonly used statistical functions in Excel. However, if you want to test a hypothesis and determine if a sample mean is significantly different from a population mean, you need a statistical test. One of the statistical tests available in Excel is Z.TEST.
A. Definition of Z.TEST
Z.TEST is an Excel function used to test a hypothesis about the mean of a population when the population standard deviation is known. It calculates the probability that the observed sample mean is statistically different from the population mean. The Z.TEST function returns the one-tailed probability value of the Z-test.
B. Explanation of how Z.TEST works
When you use Z.TEST, you are testing a null hypothesis. The null hypothesis states that there is no significant difference between the sample mean and the population mean. The alternative hypothesis states that there is a significant difference between the two means. If the probability value returned by Z.TEST is less than the significance level of your test, you can reject the null hypothesis and conclude that there is a significant difference between the two means.
C. Difference between Z.TEST and T.TEST
Another statistical test available in Excel is T.TEST. T.TEST is used when the population standard deviation is unknown. The formula for T.TEST is different from Z.TEST. T.TEST uses a t-distribution instead of a standard normal distribution. The t-distribution is used when the sample size is small, and the population standard deviation is unknown. If you know the population standard deviation, you should use Z.TEST. If you don't know the population standard deviation and have a small sample, use T.TEST.
How to Use Z.TEST in Excel
Z.TEST is an Excel function that is used to determine whether two sets of data are significantly different from each other based on their means. This statistical test is useful in many fields and can be performed using Excel’s Z.TEST formula. Here’s how.
Steps to Follow When Using Z.TEST in Excel
- Step 1: Open Excel and enter the data sets you want to compare into two columns.
- Step 2: Decide on the significance level for your test. This is typically set at 0.05 or 0.01, but can be adjusted as needed.
- Step 3: Click on any cell in your worksheet to activate Excel’s formula bar.
- Step 4: Type “=Z.TEST” into the formula bar, followed by the range of cells containing the first data set and the range of cells containing the second data set. For example, you might type “=Z.TEST(A1:A10,B1:B10,0.05,2)” to compare the means of two sets of data contained in cells A1 through A10 and B1 through B10.
- Step 5: Press enter to execute the formula and see the test results.
Examples of Datasets Where Z.TEST Can Be Applied
Z.TEST can be used to compare the means of any two data sets, so there are many examples where this test might be useful. For instance:
- Comparing the average hours of sleep for two different groups of people.
- Assessing the effectiveness of two different teaching methods by comparing their students’ grades.
- Comparing the average salaries of men and women in a particular field.
Interpretation of the Results Obtained from Z.TEST
The results of a Z.TEST in Excel will either indicate that the means of the two data sets are significantly different or that they are not significantly different. To interpret these results:
- If the p-value of your test is less than your chosen significance level, you can reject the null hypothesis (which is that the means of the two data sets are the same) and conclude that the means are significantly different.
- Conversely, if the p-value is greater than your chosen significance level, you cannot reject the null hypothesis and must conclude that there is insufficient evidence to say that the means are significantly different.
Z.TEST Formula in Excel
Excel provides a wide range of statistical functions that allow users to analyze data efficiently. One of the most commonly used statistical functions in Excel is Z.TEST. Z.TEST is used to calculate the significance of the difference between two sample means. It is a useful tool for data analysis and hypothesis testing. In this blog post, we will explain the syntax of the Z.TEST formula, the arguments used in the formula, and provide tips for using it correctly.
Syntax of the Z.TEST Formula
The syntax of the Z.TEST formula in Excel is as follows:
=Z.TEST(array1, [array2], [sigma])
The Z.TEST formula requires at least one argument to be specified. The array1 argument represents the first data set, and array2 represents the second data set. Sigma is an optional argument that represents the population standard deviation. Let's take a closer look at these arguments.
Explanation of the Arguments Used in the Formula
The array1 argument is required, and it represents the first data set. It can be either an array or a reference to a range of cells. This argument must contain at least 2 values.
=Z.TEST(A1:A10)
The array2 argument is optional, and it represents the second data set. Like array1, it can also be either an array or a reference to a range of cells. If array2 is omitted, then it is assumed that the two data sets have the same size and are independent. However, if array2 is specified, then the two data sets must have the same size and be independent.
=Z.TEST(A1:A10, B1:B10)
The sigma argument is also optional, and it represents the population standard deviation. If this argument is omitted, then the function uses the sample standard deviation to calculate the test statistic. If the sigma argument is specified, then the function assumes that the population standard deviations of the two data sets are equal.
=Z.TEST(A1:A10, B1:B10, 1.5)
Tips for Using the Formula Correctly
Here are some tips for using the Z.TEST formula correctly:
- Make sure that your data sets are independent.
- Ensure that your data is normally distributed.
- If you are testing for a one-tailed hypothesis, then you need to divide your significance level by 2.
- When calculating the test statistic, be sure to use the correct standard deviation.
- Always check your output. If the p-value is less than the significance level, then you can reject the null hypothesis.
Z.TEST vs. Z.TEST.S
In Excel, Z.TEST and Z.TEST.S are both used to test the significance of a sample mean in relation to a known or hypothesized population mean. However, there are some key differences between the two formulas.
Definition of Z.TEST.S
Z.TEST.S is a statistical function used to find out whether the hypothesis of a normal distribution with a known standard deviation is correct or not. This formula accepts two arguments: the sample range and the population standard deviation. It returns the probability that the observed sample mean could have been obtained by chance assuming that the null hypothesis is true.
Comparison of Z.TEST and Z.TEST.S
One of the main differences between the two formulas is the presence of a second argument in Z.TEST.S, which specifies the population standard deviation. In contrast, Z.TEST only requires the sample range as an argument.
- Z.TEST: This formula assumes that the population standard deviation is unknown and estimates it based on the sample data. It returns the probability that the observed sample mean could have been obtained by chance assuming that the null hypothesis is true.
- Z.TEST.S: This formula assumes that the population standard deviation is known and uses it to calculate the test statistic. It returns the probability that the observed sample mean could have been obtained by chance assuming that the null hypothesis is true.
When to use Z.TEST.S instead of Z.TEST
Z.TEST.S should be used when the population standard deviation is known or when the sample size is small (n <= 30). In these cases, Z.TEST.S provides a more accurate estimate of the significance level compared to Z.TEST.
On the other hand, Z.TEST is more appropriate when the population standard deviation is unknown or when the sample size is large (n > 30). In such cases, Z.TEST provides a reliable estimate of the significance level and avoids underestimating the true population standard deviation.
Common Mistakes When Using Z.TEST
Even though the Z.TEST function is straightforward to use, it is essential to avoid these common mistakes:
Failure to specify the correct arguments
The Z.TEST function requires two sets of arguments - the sample data and the population mean. Ensure that you use the correct data sets and do not mix up the inputs. If the Z.TEST returns a #VALUE! error, check if the inputs are correct. Also, ensure that the two sets of data have an equal number of entries.
Misinterpretation of the results
Z.TEST provides the probability of obtaining the given sample mean when sampled from a population with a known mean. Based on this probability value, you can decide whether to accept or reject the null hypothesis. However, the probability value is not the probability of the null hypothesis being true or false. Therefore, be sure to understand the implications of the result and how to interpret the p-value correctly.
Incorrect selection of the significance level
The significance level is the probability threshold below which you reject the null hypothesis. The default value is 0.05, but you can choose any value depending on your requirements. When using Z.TEST, it is crucial to choose the significance level that aligns with your research question. If you choose a high significance level, you increase the risk of falsely rejecting the null hypothesis. Similarly, choosing a low significance level may result in a failure to reject the null hypothesis even if it is not accurate.
In conclusion, Z.TEST is a powerful Excel formula that helps in testing the significance of sample data points against a population. Throughout this blog post, we have covered a range of topics related to Z.TEST, ranging from its syntax, usage, and examples. Here is a summary of the key points we covered in this blog post:
Summary of the key points covered in the blog post
- Z.TEST helps in determining whether a sample data set is different from the population or not.
- Z.TEST uses a Z-distribution to calculate the p-value for a given set of data points.
- Z.TEST can be used for both one-tailed and two-tailed tests.
- The formula for Z.TEST is "=Z.TEST(array, x, sigma)".
- Z.TEST is particularly useful in hypothesis testing.
It is important to use Z.TEST correctly in statistical analysis to avoid drawing incorrect conclusions. Understanding the underlying concepts behind Z.TEST and its limitations is vital for anyone working with data.
Importance of using Z.TEST correctly in statistical analysis
By using Z.TEST appropriately, you can determine whether the results obtained from a set of data are statistically significant or not. This helps in drawing conclusions that are more robust and accurate. Moreover, it helps in identifying trends and patterns that can be further analyzed and used for business and research purposes.
Therefore, it is important to use Z.TEST correctly in statistical analysis to ensure that you get reliable and accurate results that can be used for decision making.
Call to action for readers to try using Z.TEST in their own datasets
As a reader of this blog post, we urge you to try out Z.TEST in your own datasets. It is a simple formula that can be implemented easily in Excel. By using Z.TEST, you can better understand the significance of your data and use it to make informed decisions.
We hope that this blog post has helped you gain a better understanding of Z.TEST and how it can be used in statistical analysis. For more information on Excel formulas and their applications, stay tuned for more blog posts from our team!

Immediate Download
MAC & PC Compatible
Free Email Support
Related aticles

The Benefits of Excel Dashboards for Data Analysts

Unlock the Power of Real-Time Data Visualization with Excel Dashboards

Unlocking the Potential of Excel's Data Dashboard

Unleashing the Benefits of a Dashboard with Maximum Impact in Excel

Exploring Data Easily and Securely: Essential Features for Excel Dashboards

Unlock the Benefits of Real-Time Dashboard Updates in Excel

Unleashing the Power of Excel Dashboards

Understanding the Benefits and Challenges of Excel Dashboard Design and Development

Leverage Your Data with Excel Dashboards

Crafting the Perfect Dashboard for Excel

An Introduction to Excel Dashboards

How to Create an Effective Excel Dashboard
- Choosing a selection results in a full page refresh.
Home » Excel-Built-In-Functions » Excel-Statistical-Functions » Excel-Z.Test-Function
The Excel Z.TEST Function
Function description.
For a supplied hypothesized sample mean and a supplied set of values, the Excel Z.Test function calculates the one-tailed probability value of the Z-Test .
I.e. the function returns the probability that the supplied hypothesized sample mean is greater than the mean of the supplied data values.
The Z.Test function is new to Excel 2010. However, this is simply an updated version of the Ztest function , which is available in earlier versions of Excel.
The syntax of the Z.Test function is:
where the function arguments are:
Two-tailed Probability
If you want to calculate the two-tailed probability value of the Z-Test, this can be done by using the Z.Test function, combined with the Excel Min function , as follows:
Z.Test Function Examples
Column A of the above spreadsheet on the right contains an array of 12 data values. The mean of these values is 5.25.
Cells B1 and B2 of the example spreadsheet show the Excel Z.Test function used to calculate the one-tailed probability value of the Z-Test for two different hypothesized sample means.
For the hypothesized sample mean 5.0, the one-tailed probability value of the Z-Test is calculated by the formula:
which gives the result 0.371103279 .
For the hypothesized sample mean 6.0, the one-tailed probability value of the Z-Test is calculated by the formula:
which gives the result 0.838129187 .
Note that in the above two examples, the [sigma] argument is omitted from the function. Therefore, the Z.Test function calculation uses the standard deviation of the supplied array as the population standard deviation.
For further details and examples of the Excel Z.Test function, see the Microsoft Office website .
Z.Test Function Errors
If you get an error from the Excel Z.Test Function, this is likely to be one of the following:
- Basic Excel
- List of All Excel Functions
- Text Functions
- Logical Functions
- Information Functions
- Date & Time Functions
- Lookup & Reference Functions
- Math Functions
- Statistical Functions
- Database Functions
- Financial Functions
- Engineering Functions
- Excel Vlookup Tutorial
- Pivot Table Tutorial
- Excel Formulas
- Array Formulas
- Accounting in Excel
- Tips & Tricks
- Common Excel Errors
- Excel Templates
- Excel Macros
- Excel VBA Tutorial
- Built-In VBA Functions
- Advertise With Us
- Excel Forum
- Commercial Services

How to use the Z.TEST function in Excel
In this article, we will learn How to use the Z.TEST function in Excel.
What is hypothesis testing and how to use Z -Test for hypothesis testing ?
In statistics, Hypothesis testing is used to find the estimation of mean for the population dataset using the different distribution function based on the part of population dataset named sample dataset. A statistical hypothesis, sometimes called confirmatory data analysis, is a hypothesis that is testable on the basis of observing a process that is modeled via a set of random variables. There are two types of hypothesis. One is null hypothesis which is the claimed statement and other is the alternate hypothesis which is just opposite of the null hypothesis. For example if we say maximum limit to lead in a maggi packet must not exceed 225 ppm (parts per million) and someone claims that there is more than fixed limit than null hypothesis (denoted by U 0 ) and the alternate hypothesis (denoted by U a )
U 0 = lead content in maggi packet is more than or equal to 225ppm.
U a = lead content in maggi packet is less than 225 ppm.
So the above hypothesis is an example of a right-tailed test as the underlying situation lies in the right side of the distribution curve. If the underlying situation lies on the left side then it would be called a left-tailed test. Let's take one more example which illustrates a one-tailed test. For example if selina said she can do 60 push ups on an average. Now you might doubt that statement and try to hypothesize the situation in statistics term then, the null and the alternate hypothesis is stated below
U 0 = selina can do 60 pushups
U a = selina cannot do 60 pushups
This is a two-tailed test where the underlying situation lies on both sides of the claimed statement. These tailed tests affect the outcome of the statistics. So choose the null and alternative hypothesis carefully.
A Z-test is any statistical test for which the distribution of the test statistic under the null hypothesis can be approximated by a normal distribution. Z-test tests the mean of a distribution in which we already know the population variance . Because of the central limit theorem, many test statistics are approximately normally distributed for large samples. The test statistic is assumed to have a normal distribution such as standard deviation should be known in order for an accurate z-test to be performed. For example an investor wishes to test whether the average daily return of a stock is greater than 1% can be evaluated using Z test. A Z-statistic or Z-score is a number representing how many standard deviations above or below the mean population a score derived from a Z-test is. Mathematically first we decide the null hypothesis and calculate the Z score for the distribution using the formula.
X (with a bar) is the mean of the sample array
U 0 is the estimate population mean
s is the standard deviation where s is equal to std/(n) 1/2 (where n is sample size).
As stated above Z - test follows standard normal distribution. So mathematically in Excel it follows the following formula.
Z.TEST( array,x,sigma ) = 1- Norm.S.Dist ((Average(array)- x) / (sigma/(n) 1/2 ),TRUE)
or when sigma is omitted:
Z.TEST( array,x ) = 1- Norm.S.Dist ((Average(array)- x) / (STDEV(array)/(n) 1/2 ),TRUE)
where x is the sample mean AVERAGE(array), and n is COUNT(array).
Let's learn how to do the Z test using the Z.TEST function to calculate the relation between the two given datasets (actual and observed).
Z.TEST Function in Excel
The Z.TEST function returns the probability that the sample mean would be greater than the average of observations in the data set (array). The function takes the following arguments.
Z.TEST Function syntax for one tailed probability:
The function can also be used to commute two-tailed probability.
array : sample data distribution
x : value for which z test is evaluated
[sigma] : [optional] The population (known) standard deviation. If omitted, the sample standard deviation is used.
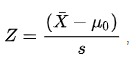
All of these might be confusing to understand. Let's understand how to use the function using an example. Here we have a sample dataset Sales and we need to find the Z test probability for the given hypothesized population mean assuming one tailed test.
Use the formula:
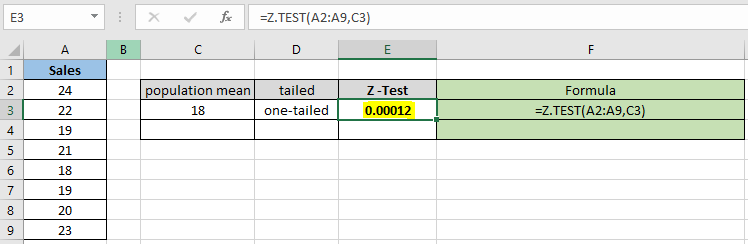
The probability value comes in decimal, so you can convert the value to percentage changing the format of the cell to percentage.
As you can see the probability value for the hypothesized population mean 18 comes out to be 0.012% for the one tailed distribution.
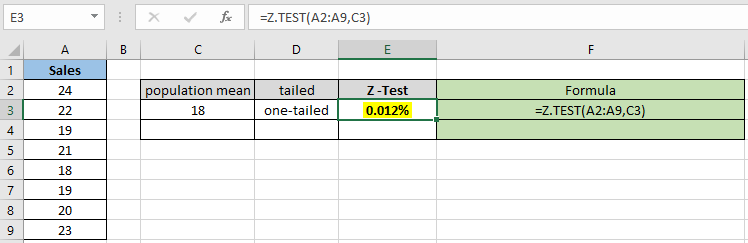
Now calculate the probability assuming two tailed distributions having the same parameters.
For the two tailed distribution the probability gets doubled for the same sample dataset. So it's necessary to check the null hypothesis and alternate hypothesis.
Now calculate the probability for the different hypothesized population mean and one tailed distribution.
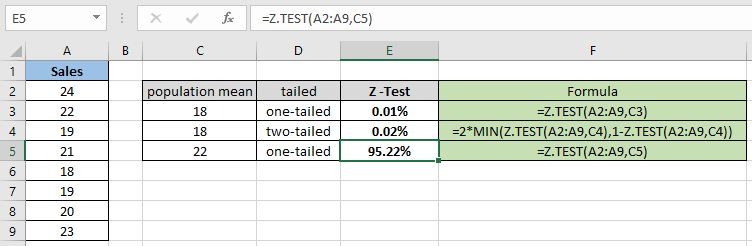
As you can see the probability value for the hypothesized population mean 22 comes out to be 95.22% for the one tailed distribution.
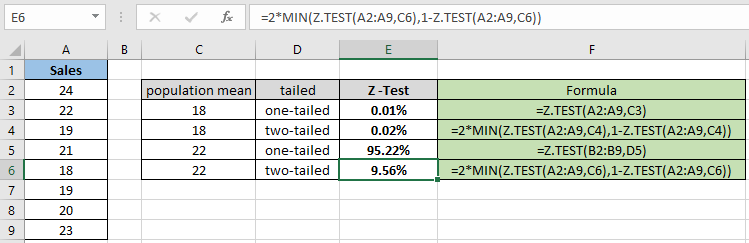
As you can differ from the above snapshot that the probability value gets less when calculating the two tailed distribution. The function returns 9.56% for the hypothesized population mean 22.
Z.TEST represents the probability that the sample mean would be greater than the observed value AVERAGE(array), when the underlying population mean is 0 . From the symmetry of the Normal distribution, if AVERAGE(array) < x, Z.TEST will return a value greater than 0.5.
Here are all the observational notes using the Z.TEST function in Excel Notes :
- The function only works with numbers. If population mean or sigma argument is non numeric, the function returns #VALUE! error.
- Value in decimal or value in percentage is the same value in Excel. Convert the value to percentage, if required.
- The function returns #NUM! Error, if the sigma argument is 0.
- The function returns #N/A! Error if the provided array is empty.
- If the standard deviation of the array is 0 and sigma argument is omitted.
- If the array contains only one value.
Hope this article about How to use the Z.TEST function in Excel is explanatory. Find more articles on statistical formulas and related Excel functions here. If you liked our blogs, share it with your friends on Facebook . And also you can follow us on Twitter and Facebook . We would love to hear from you, do let us know how we can improve, complement or innovate our work and make it better for you. Write to us at [email protected].
Related Articles :
How To Use Excel T TEST Function in Excel : The T.TEST is used to determine the confidence of an analysis. Mathematically, it is used to know if the mean of the two samples are equal or not. T.TEST is used to accept or reject the null hypothesis.
How to use Excel F.TEST Function in Excel : The F.TEST Function is used to calculate F statistic of two samples in excel internally and returns the two tailed probability of the F statistic under Null Hypothesis.
How to use the DEVSQ Function in Excel : DEVSQ function is a built-in statistical function to calculate the sum of squared deviations from the mean or average of the range of data values provided.
How to use Excel NORM.DIST Function : Calculate the Z score for the normal cumulative distribution for the pre specified values using the NORMDIST function in Excel.
How to use Excel NORM.INV Function : Calculate the inverse of Z score for the normal cumulative distribution for the pre-specified probability values using the NORM.INV function in Excel.
How to Calculate Standard Deviation in Excel : To calculate the standard deviation we have different functions in Excel. The standard deviation is the square root of the variance value but It tells more about the dataset than variance.
How to use the VAR function in Excel : Calculate the variance for the sample dataset in excel using the VAR function in Excel.
Popular Articles :
How to use the IF Function in Excel : The IF statement in Excel checks the condition and returns a specific value if the condition is TRUE or returns another specific value if FALSE.
How to use the VLOOKUP Function in Excel : This is one of the most used and popular functions of excel that is used to lookup value from different ranges and sheets.
How to use the SUMIF Function in Excel : This is another dashboard essential function. This helps you sum up values on specific conditions.
How to use the COUNTIF Function in Excel : Count values with conditions using this amazing function. You don't need to filter your data to count specific values. Countif function is essential to prepare your dashboard.
Leave a Reply Cancel reply
Your email address will not be published. Required fields are marked *
To avoid automated spam,Please enter the value * 1 × nine =
Related Excel Tips
Summarize data according to criteria from the...
How to Count Blank and Non Blank Cells in Mic...
Avoiding Errors when Subtracting Times in Mic...
Determining whether Two Given Dates Occur wit...
PHI function...
- Basic Excel
- Excel 365 Functions
- Excel Business Templates and Dashboards
- Excel Dashboards
- Excel Date and Time
- Excel Errors
- Excel Functions
- Excel Functions List
- Excel General
- Excel Macros and VBA
- Excel Spanish
- Excel Text, Editing and Format
- Excel Tips and Tricks
The applications/code on this site are distributed as is and without warranties or liability. In no event shall the owner of the copyrights, or the authors of the applications/code be liable for any loss of profit, any problems or any damage resulting from the use or evaluation of the applications/code.
- Excel Editing
- Excel Format

Get latest updates from exceltip in your mail.
Google serves cookies to analyse traffic to this site. Information about your use of our site is shared with Google for that purpose
Privacy Overview
Strictly necessary cookies.
This website uses cookies so that we can provide you with the best user experience possible. Cookie information is stored in your browser and performs functions such as recognising you when you return to our website and helping our team to understand which sections of the website you find most interesting and useful.
You can adjust all of your cookie settings by navigating the tabs on the left hand side.
Strictly Necessary Cookie should be enabled at all times so that we can save your preferences for cookie settings.
If you disable this cookie, we will not be able to save your preferences. This means that every time you visit this website you will need to enable or disable cookies again.
Six Sigma & SPC Excel Add-in
- Questions? Contact Us
- 888-468-1537
Statistical Analysis in QI Macros
Statistics wizard, data normality, hypothesis tests, test of means, equivalence tests, test of variances, test for outliers, test of proportion, test relationship, non-parametric tests.
Hypothesis Testing Cheat Sheet
Knowledge Base | Online User Guide
- Free 30-Day Trial
- Powerful SPC Software for Excel
- SPC - Smart Performance Charts
- Who Uses QI Macros?
- What Do Our Customers Say?
- QI Macros SPC Software Reviews
- SPC Software Comparison
- Control Chart
- Histogram with Cp Cpk
- Pareto Chart
- Automated Fishbone Diagram
- Gage R&R MSA
- Data Mining Tools
- Statistical Analysis - Hypothesis Testing
- Chart and Stat Wizards
- Lean Six Sigma Excel Templates
- Technical Support - PC
- Technical Support - Mac
- QI Macros FAQs
- Upgrade History
- Submit Enhancement Request
- Data Analysis Services
- Free QI Macros Webinar
- Free QI Macros Video Tutorials
- How to Setup Excel for QI Macros
- Free Healthcare Data Analytics Course
- Free Lean Six Sigma Webinars
- Animated Lean Six Sigma Video Tutorials
- Free Agile Lean Six Sigma Trainer Training
- Free White Belt Training
- Free Yellow Belt Training
- Free Green Belt Training
- QI Macros Resources
- QI Macros Knowledge Base | User Guide
- Excel Tips and Tricks
- Lean Six Sigma Resources
- QI Macros Monthly Newsletter
- Improvement Insights Blog
- Buy QI Macros
- Quantity Discounts and W9
- Hassle Free Guarantee
QI Macros Reviews CNET Five Star Review Industry Leaders Our Customers
Home » Statistical Analysis Excel » z Test
Struggling to Run a Z-Test in Excel?
Qi macros can run a z test and interpret the results for you in seconds, when to use the z-test two sample for means.
- To compare population and sample means to determine if there is a significant difference.
- To compare means between two samples.
- To compare the mean of one sample to a given constant.
The Z-test is typically used in evaluating the results of standardized tests. Are the results from a sample of students outside of or within the standard test performance?
z Test Example using QI Macros add-in for Excel
New Training Technique Designed to Increase IQ - This example was taken from Statistical Analysis in Excel for Dummies by Joseph Schmuller.
Imagine a new training technique designed to increase IQ. Take a sample of 25 people and train them using the new technique. Take another sample of 25 people and give them no special training. Input the results in Excel.
To conduct a z test using QI Macros add-in:

- Now click on QI Macros Menu > Statistical Tools > f and t tests > Z-Test two sample for means test.

- Q Macros will perform the z test calculations AND interpret the results for you:

- QI Macros will also draw a Values Plot to help you visualize the data.
Interpreting the z test Results
QI Macros compares the p-value (0.192) to the significance level (0.05) and interprets the result for you. In this example we "Cannot Reject the Null Hypothesis because p > 0.05 (Means are not Different)."
- The null hypothesis H0 is that the mean difference = 0 or in other words the means are the same
- The alternative hypothesis Ha is that the mean difference is > 0 or in other words that the mean of the trained population is larger
Since the null hypothesis is that the means are the same this is a two-sided test. Therefore, use the two-tail values for your analysis.
Since the z statistic < zcritical (1.305 < 1.960) and p value > a ( 0.192> 0.05) , we cannot reject the null hypothesis (accept the null hypothesis) that the means are the same.
One-Sample Z-Test
To do a one-sample z-test on the New data above, use native Excel formulas in an empty cell:
- =ztest(A1:A26, 100)
- Gives p =0.015
- Since the p-value is < 0.05, we can Reject the Null Hypothesis (Means are Different/Means are not the Same).
Stop Struggling with z Tests! Start conducting z Tests in just minutes.
Download a free 30-day trial. run z tests now, qi macros can draw these charts too.
- SPC Software for Excel
- Free 30 Day Trial
- On-line Tech Support
- QI Macros Reviews
- Free QI Macros Training
- Privacy Policy

KnowWare International, Inc. 2696 S. Colorado Blvd., Ste. 555 Denver, CO 80222 USA Toll-Free: 1-888-468-1537 Local: (303) 756-9144
How to Perform One Sample & Two Sample Z-Tests in Excel
A one sample z-test is used to test whether a population mean is significantly different than some hypothesized value.
A two sample z-test is used to test whether two population means are significantly different from each other.
The following examples show how to perform each type of test in Excel.
Example 1: One Sample Z-Test in Excel
Suppose the IQ in a population is normally distributed with a mean of μ = 100 and standard deviation of σ = 15.
A scientist wants to know if a new medication affects IQ levels, so she recruits 20 patients to use it for one month and records their IQ levels at the end of the month.
We can use the following formula in Excel to perform a one sample z-test to determine if the new medication causes a significant difference in IQ levels:
The following screenshot shows how to use this formula in practice:

The one-tailed p-value is 0.181587 . Since we’re performing a two-tailed test, we can multiply this value by 2 to get p = 0.363174 .
Since this p-value is not less than .05, we do not have sufficient evidence to reject the null hypothesis.
Thus, we conclude that the new medication does not significantly affect IQ level.
Example 2: Two Sample Z-Test in Excel
Suppose the IQ levels among individuals in two different cities are known to be normally distributed each with population standard deviations of 15.
A scientist wants to know if the mean IQ level between individuals in city A and city B are different, so she selects a simple random sample of 20 individuals from each city and records their IQ levels.
The following screenshot shows the IQ levels for the individuals in each sample:

To perform a two sample z-test to determine if the mean IQ level is different between the two cities, click the Data tab along the top ribbon, then click the Data Analysis button within the Analysis group.

If you don’t see Data Analysis as an option, you need to first load the Analysis ToolPak in Excel.
Once you click this button, select z-Test: Two Sample for Means in the new window that appears:

Once you click OK , you can fill in the following information:

Once you click OK , the results will appear in cell E1:

The test statistic for the two sample z-test is -1.71817 and the corresponding p-value is .085765.
Thus, we conclude that the mean IQ level is not significantly different between the two cities.
Additional Resources
The following tutorials explain how to perform other common statistical tests in Excel:
How to Conduct a One Sample t-Test in Excel How to Conduct a Two Sample t-Test in Excel How to Conduct a Paired Samples t-Test in Excel How to Perform Welch’s t-Test in Excel
Pandas: How to Count Occurrences of Specific Value in Column
What is balanced accuracy (definition & example), related posts, how to create a stem-and-leaf plot in spss, how to create a correlation matrix in spss, how to convert date of birth to age..., excel: how to highlight entire row based on..., how to add target line to graph in..., excel: how to use if function with negative..., excel: how to use if function with text..., excel: how to use greater than or equal..., excel: how to use if function with multiple..., how to extract number from string in pandas.
- Mastering Hypothesis Testing in Excel: A Practical Guide for Students
Excel for Hypothesis Testing: A Practical Approach for Students

Hypothesis testing lies at the heart of statistical inference, serving as a cornerstone for drawing meaningful conclusions from data. It's a methodical process used to evaluate assumptions about a population parameter, typically based on sample data. The fundamental idea behind hypothesis testing is to assess whether observed differences or relationships in the sample are statistically significant enough to warrant generalizations to the larger population. This process involves formulating null and alternative hypotheses, selecting an appropriate statistical test, collecting sample data, and interpreting the results to make informed decisions. In the realm of statistical software, SAS stands out as a robust and widely used tool for data analysis in various fields such as academia, industry, and research. Its extensive capabilities make it particularly favored for complex analyses, large datasets, and advanced modeling techniques. However, despite its versatility and power, SAS can have a steep learning curve, especially for students who are just beginning their journey into statistics. The intricacies of programming syntax, data manipulation, and interpreting output may pose challenges for novice users, potentially hindering their understanding of statistical concepts like hypothesis testing. If you need assistance with your Excel homework , understanding hypothesis testing is essential for performing statistical analyses and drawing meaningful conclusions from data using Excel's built-in functions and tools.

Enter Excel, a ubiquitous spreadsheet software that most students are already familiar with to some extent. While Excel may not offer the same level of sophistication as SAS in terms of advanced statistical procedures, it remains a valuable tool, particularly for introductory and intermediate-level analyses. Its intuitive interface, user-friendly features, and widespread accessibility make it an attractive option for students seeking a practical approach to learning statistics. By leveraging Excel's built-in functions, data visualization tools, and straightforward formulas, students can gain hands-on experience with hypothesis testing in a familiar environment. In this blog post, we aim to bridge the gap between theoretical concepts and practical application by demonstrating how Excel can serve as a valuable companion for students tackling hypothesis testing problems, including those typically encountered in SAS assignments. We will focus on demystifying the process of hypothesis testing, breaking it down into manageable steps, and showcasing Excel's capabilities for conducting various tests commonly encountered in introductory statistics courses.
Understanding the Basics
Hypothesis testing is a fundamental concept in statistics that allows researchers to draw conclusions about a population based on sample data. At its core, hypothesis testing involves making a decision about whether a statement regarding a population parameter is likely to be true. This decision is based on the analysis of sample data and is guided by two competing hypotheses: the null hypothesis (H0) and the alternative hypothesis (Ha). The null hypothesis represents the status quo or the absence of an effect. It suggests that any observed differences or relationships in the sample data are due to random variation or chance. On the other hand, the alternative hypothesis contradicts the null hypothesis and suggests the presence of an effect or difference in the population. It reflects the researcher's belief or the hypothesis they aim to support with their analysis.
Formulating Hypotheses
In Excel, students can easily formulate hypotheses using simple formulas and logical operators. For instance, suppose a researcher wants to test whether the mean of a sample is equal to a specified value. They can use the AVERAGE function in Excel to calculate the sample mean and then compare it to the specified value using logical operators like "=" for equality. If the calculated mean is equal to the specified value, it supports the null hypothesis; otherwise, it supports the alternative hypothesis.
Excel's flexibility allows students to customize their hypotheses based on the specific parameters they are testing. Whether it's comparing means, proportions, variances, or other population parameters, Excel provides a user-friendly interface for formulating hypotheses and conducting statistical analysis.
Selecting the Appropriate Test
Excel offers a plethora of functions and tools for conducting various types of hypothesis tests, including t-tests, z-tests, chi-square tests, and ANOVA (analysis of variance). However, selecting the appropriate test requires careful consideration of the assumptions and conditions associated with each test. Students should familiarize themselves with the assumptions underlying each hypothesis test and assess whether their data meets those assumptions. For example, t-tests assume that the data follow a normal distribution, while chi-square tests require categorical data and independence between observations.
Furthermore, students should consider the nature of their research question and the type of data they are analyzing. Are they comparing means of two independent groups or assessing the association between categorical variables? By understanding the characteristics of their data and the requirements of each test, students can confidently choose the appropriate hypothesis test in Excel.
T-tests are statistical tests commonly used to compare the means of two independent samples or to compare the mean of a single sample to a known value. These tests are valuable in various fields, including psychology, biology, economics, and more. In Excel, students can employ the T.TEST function to conduct t-tests, providing them with a practical and accessible way to analyze their data and draw conclusions about population parameters based on sample statistics.
Independent Samples T-Test
The independent samples t-test, also known as the unpaired t-test, is utilized when comparing the means of two independent groups. This test is often employed in experimental and observational studies to assess whether there is a significant difference between the means of the two groups. In Excel, students can easily organize their data into separate columns representing the two groups, calculate the sample means and standard deviations for each group, and then use the T.TEST function to obtain the p-value. The p-value obtained from the T.TEST function represents the probability of observing the sample data if the null hypothesis, which typically states that there is no difference between the means of the two groups, is true.
A small p-value (typically less than the chosen significance level, commonly 0.05) indicates that there is sufficient evidence to reject the null hypothesis in favor of the alternative hypothesis, suggesting a significant difference between the group means. By conducting an independent samples t-test in Excel, students can not only assess the significance of differences between two groups but also gain valuable experience in data analysis and hypothesis testing, which are essential skills in various academic and professional settings.
Paired Samples T-Test
The paired samples t-test, also known as the dependent t-test or matched pairs t-test, is employed when comparing the means of two related groups. This test is often used in studies where participants are measured before and after an intervention or when each observation in one group is matched or paired with a specific observation in the other group. Examples include comparing pre-test and post-test scores, analyzing the performance of individuals under different conditions, and assessing the effectiveness of a treatment or intervention. In Excel, students can perform a paired samples t-test by first calculating the differences between paired observations (e.g., subtracting the before-measurement from the after-measurement). Next, they can use the one-sample t-test function, specifying the calculated differences as the sample data. This approach allows students to determine whether the mean difference between paired observations is statistically significant, indicating whether there is a meaningful change or effect between the two related groups.
Interpreting the results of a paired samples t-test involves assessing the obtained p-value in relation to the chosen significance level. A small p-value suggests that there is sufficient evidence to reject the null hypothesis, indicating a significant difference between the paired observations. This information can help students draw meaningful conclusions from their data and make informed decisions based on statistical evidence. By conducting paired samples t-tests in Excel, students can not only analyze the relationship between related groups but also develop critical thinking skills and gain practical experience in hypothesis testing, which are valuable assets in both academic and professional contexts. Additionally, mastering the application of statistical tests in Excel can enhance students' data analysis skills and prepare them for future research endeavors and real-world challenges.
Chi-Square Test
The chi-square test is a versatile statistical tool used to assess the association between two categorical variables. In essence, it helps determine whether the observed frequencies in a dataset significantly deviate from what would be expected under certain assumptions. Excel provides a straightforward means to perform chi-square tests using the CHISQ.TEST function, which calculates the probability associated with the chi-square statistic.
Goodness-of-Fit Test
One application of the chi-square test is the goodness-of-fit test, which evaluates how well the observed frequencies in a single categorical variable align with the expected frequencies dictated by a theoretical distribution. This test is particularly useful when researchers wish to ascertain whether their data conforms to a specific probability distribution. In Excel, students can organize their data into a frequency table, listing the categories of the variable of interest along with their corresponding observed frequencies. They can then specify the expected frequencies based on the theoretical distribution they are testing against. For example, if analyzing the outcomes of a six-sided die roll, where each face is expected to occur with equal probability, the expected frequency for each category would be the total number of observations divided by six.
Once the observed and expected frequencies are determined, students can employ the CHISQ.TEST function in Excel to calculate the chi-square statistic and its associated p-value. The p-value represents the probability of obtaining a chi-square statistic as extreme or more extreme than the observed value under the assumption that the null hypothesis is true (i.e., the observed frequencies match the expected frequencies). Interpreting the results of the goodness-of-fit test involves comparing the calculated p-value to a predetermined significance level (commonly denoted as α). If the p-value is less than α (e.g., α = 0.05), there is sufficient evidence to reject the null hypothesis, indicating that the observed frequencies significantly differ from the expected frequencies specified by the theoretical distribution. Conversely, if the p-value is greater than α, there is insufficient evidence to reject the null hypothesis, suggesting that the observed frequencies align well with the expected frequencies.
Test of Independence
Another important application of the chi-square test in Excel is the test of independence, which evaluates whether there is a significant association between two categorical variables in a contingency table. This test is employed when researchers seek to determine whether the occurrence of one variable is related to the occurrence of another. To conduct a test of independence in Excel, students first create a contingency table that cross-tabulates the two categorical variables of interest. Each cell in the table represents the frequency of occurrences for a specific combination of categories from the two variables.
Similar to the goodness-of-fit test, students then calculate the expected frequencies for each cell under the assumption of independence between the variables. Using the CHISQ.TEST function in Excel, students can calculate the chi-square statistic and its associated p-value based on the observed and expected frequencies in the contingency table. The interpretation of the test results follows a similar procedure to that of the goodness-of-fit test, with the p-value indicating whether there is sufficient evidence to reject the null hypothesis of independence between the two variables.
Excel, despite being commonly associated with spreadsheet tasks, offers a plethora of features that make it a versatile and powerful tool for statistical analysis, especially for students diving into the intricacies of hypothesis testing. Its widespread availability and user-friendly interface make it accessible to students at various levels of statistical proficiency. However, the true value of Excel lies not just in its accessibility but also in its ability to facilitate a hands-on learning experience that reinforces theoretical concepts.
At the core of utilizing Excel for hypothesis testing is a solid understanding of the fundamental principles of statistical inference. Students need to grasp concepts such as the null and alternative hypotheses, significance levels, p-values, and test statistics. Excel provides a practical platform for students to apply these concepts in a real-world context. Through hands-on experimentation with sample datasets, students can observe how changes in data inputs and statistical parameters affect the outcome of hypothesis tests, thus deepening their understanding of statistical theory.
Post a comment...
Mastering hypothesis testing in excel: a practical guide for students submit your homework, attached files.
IMAGES
VIDEO
COMMENTS
We can use the following formula in Excel to perform a one sample z-test to determine if the new medication causes a significant difference in IQ levels: =Z.TEST(A2:A21, 100, 15) The following screenshot shows how to use this formula in practice: The one-tailed p-value is 0.181587. Since we're performing a two-tailed test, we can multiply ...
Z.TEST represents the probability that the sample mean would be greater than the observed value AVERAGE (array), when the underlying population mean is μ0. From the symmetry of the Normal distribution, if AVERAGE (array) < x, Z.TEST will return a value greater than 0.5. The following Excel formula can be used to calculate the two-tailed ...
Step 1: First, we need to calculate the variables for these two values using the VAR.P function. Step 2: Go to the "Data" tab and click "Data Analysis.". Scroll down and select z-Test: Two Sample for Means" and click on "OK.". Step 3: For the "Variable 1 Range," select "Student 1" scores. For the "Variable 2 Range ...
Z Test in Excel helps perform hypothesis testing to assess if a finding is statistically significant. And Excel offers an inbuilt Statistical function, Z.TEST(), which determines the one-tailed P-value of a Z-test. Users can utilize Z.TEST() in scenarios such as testing if a stock's average daily return exceeds a certain percentage.
We use Z.TEST in Excel to find the p-value for this hypothesis test. Enter the data into a column in Excel. Suppose this is from cell A1 to A9. Into another cell enter =Z.TEST (A1:A9,5,3) The result is 0.41207. Since our p-value exceeds 10%, we fail to reject the null hypothesis.
Refer to this tutorial for a step-by-step explanation of how to perform this hypothesis test in Excel. Example 4: One Proportion z-test in Excel. A one proportion z-test is used to compare an observed proportion to a theoretical one. For example, suppose a phone company claims that 90% of its customers are satisfied with their service.
For calculating the two-tailed probability-value of a z test Excel for the above data with a hypothesized population mean of 4, we will use the following formula: We get the result below: Things to remember about the Z TEST Excel Function. Z.TEST represents the probability that the sample mean would be higher than the observed value AVERAGE ...
The Z.TEST formula in Excel is a statistical function that is used to test the null hypothesis that the mean of a population is equal to a specified value. It compares a sample mean to a hypothesized population mean, and returns a p-value that indicates the likelihood of observing the sample mean if the null hypothesis were true.
For a supplied hypothesized sample mean and a supplied set of values, the Excel Z.Test function calculates the one-tailed probability value of the Z-Test . I.e. the function returns the probability that the supplied hypothesized sample mean is greater than the mean of the supplied data values. The Z.Test function is new to Excel 2010.
It's a type of hypothesis testing that allows you to make comparisons between a sample and a population when the population's standard deviation is known and the sample size is large (typically over 30). ... What are the basic steps to conduct a Z-Test in Excel? A: To conduct a Z-Test in Excel: 1. Prepare your data, ensuring it's clean and ...
Use the formula: = Z.TEST ( A2:A9 , C3 ) The probability value comes in decimal, so you can convert the value to percentage changing the format of the cell to percentage. As you can see the probability value for the hypothesized population mean 18 comes out to be 0.012% for the one tailed distribution.
This video shows how to conduct a one-sample hypothesis z-test for the mean in Microsoft Excel using the built-in Data Analysis (from raw data).How to load ...
In Excel, we have a function for Z-Test named as ZTest, where, as per syntax, we need to have Array and X value (Hypothesized sample mean) and Sigma value (Optional). Mostly X is a minimum of 95% probability, which can take from 0 to 5. Another way of doing Z-Test is from the Data Analysis option from the Data menu tab.
Hypothesis Z-Test using Excel | Statistical Tests | Data Analysis using Excel𝐓𝐢𝐦𝐞𝐋𝐢𝐧𝐞: 00:00 Introduction 01:33 Hypothesis Testing and general ove...
and then select 'Z.Test'. Hypothesis Tests [Excel 2008]: Function-ZTEST 6 GOAL How to conduct a one-population hypothesis-test using the Excel 2008 Z.TEST function in two situations: 1) Test of Measurements 2) Test of Proportions Assumption: Population standard deviation is known. Notation for the three arguments of Z.TEST function:
Related posts: Null Hypothesis: Definition, Rejecting & Examples and Understanding Significance Levels. Two-Sample Z Test Hypotheses. Null hypothesis (H 0): Two population means are equal (µ 1 = µ 2).; Alternative hypothesis (H A): Two population means are not equal (µ 1 ≠ µ 2).; Again, when the p-value is less than or equal to your significance level, reject the null hypothesis.
Hypothesis Test in Excel: Manual Steps. Step 1: Type your data into a single column in Excel. For example, type your data into cells A1:A40. Step 2: Click the "Data" tab and then click "Data Analysis.". If you don't see the Data Analysis button then you may need to load the Data Analysis Toolpak. Step 3: Click " Descriptive ...
Here's how you start: STEP 1: Click on an empty cell where you want the Z critical value to appear. STEP 2: Enter "=NORM.S.INV (α)" into the cell, replacing α with your chosen significance level. Press 'Enter,' and Excel will calculate the Z critical value for you.
One-Sample Z-Test. To do a one-sample z-test on the New data above, use native Excel formulas in an empty cell: =ztest (A1:A26, 100) Gives p =0.015. Since the p-value is < 0.05, we can Reject the Null Hypothesis (Means are Different/Means are not the Same). Stop Struggling with z Tests!
On the Manage drop-down list, choose Excel Add-ins, and click Go. On the popup that appears, check Analysis ToolPak and click OK. After you enable it, click Data Analysis in the Data menu to display the analyses you can perform. Among other options, the popup presents three types of t-test, which we'll cover next.
Two Sample Z test in ExcelIn this video, we will show how you can perform a two sample z-test using Excel. A z-test is a statistical tool in hypothesis testi...
A one sample z-test is used to test whether a population mean is significantly different than some hypothesized value.. A two sample z-test is used to test whether two population means are significantly different from each other.. The following examples show how to perform each type of test in Excel. Example 1: One Sample Z-Test in Excel. Suppose the IQ in a population is normally distributed ...
Selecting the Appropriate Test. Excel offers a plethora of functions and tools for conducting various types of hypothesis tests, including t-tests, z-tests, chi-square tests, and ANOVA (analysis of variance). However, selecting the appropriate test requires careful consideration of the assumptions and conditions associated with each test.
Link to the Excel file: https://agrimetsoft.com/excelExcel Tutorial YouTube: https://bit.ly/34TTYcpHow to do #Z_Test in #Excel | #Z_Test_Example | #Statistic...
STEP 1: Park your cursor in the cell where you want the P-value to appear. STEP 2: Click the "fx" button next to the formula bar, bringing up the Insert Function dialog box. STEP 3: Now, type "T.TEST" into the search bar. When it pops up in the list, select it to open the door to calculate the P-value.