
Home » Business Process Mapping » Business Process Modeling Using BPMN

Business Process Modeling Using BPMN
- Posted on September 12, 2023
- / Under Business Process Mapping
What is BPMN
Business Modeling delves into the foundational concepts and components of BPMN (Business Process Model and Notation), a widely adopted framework for visually representing and documenting business processes. In this comprehensive exploration, we navigate through key aspects, starting with the definition of business goals and their intricate connection to related business processes. Understanding that a business process comprises a coordinated set of activities performed within a defined framework is essential to appreciating the significance of BPMN.
BPMN was introduced with a primary aim: to offer a universal notation system that bridges the gap between various stakeholders involved in process modeling. Whether it’s business analysts initiating the process drafts, technical developers responsible for translating these models into technology solutions, or business leaders overseeing and managing these processes, BPMN provides a shared visual language that facilitates clear communication and collaboration.
Defining Business Goals A business goal represents the specific objective that an organization aims to accomplish through the effective execution of its related business processes.
Understanding Business Processes A business process comprises a coordinated set of activities performed within a defined organizational and technical framework. These activities work collectively to achieve a specific business goal.
The Purpose of BPMN The primary objective of BPMN (Business Process Model and Notation) is to provide a universally comprehensible notation system. It caters to a diverse audience, including business analysts who initiate process drafts, technical developers responsible for implementing the underlying technology, and business stakeholders who manage and oversee these processes.
Elements of a BPD in BPMN In BPMN, a Business Process Diagram (BPD) consists of graphical elements designed to facilitate the creation of visual models for business process operations. These graphical objects include activities (representing work) and flow controls that dictate the sequence in which these activities are performed. BPMN is essentially a flowcharting technique customized for crafting graphical representations of business processes.
Components of a Business Process Model A Business Process Model is an interconnected network of graphical elements, encompassing activities (work) and flow controls that define the order of their execution. These graphical components enable the straightforward development of diagrams that are familiar to most business analysts, akin to traditional flowchart diagrams. The choice of these graphical elements is deliberate, ensuring they are distinguishable from each other and employ shapes familiar to modelers.
BPMN’s Versatility BPMN can also be complemented by an internal model, enabling the generation of executable Business Process Execution Language (BPEL) processes. This transforms BPMN into a standardized bridge that connects the design of business processes to their practical implementation. Consequently, BPMN can be effectively applied across three distinct levels:
- Descriptive Process Models : Suitable for high-level modeling and familiar to analysts accustomed to flowcharts.
- Analytic Process Models : Encompassing the most commonly used BPMN concepts, making it suitable for BPMN training.
- Common Executable Process Models : Focusing on elements essential for creating executable process models.
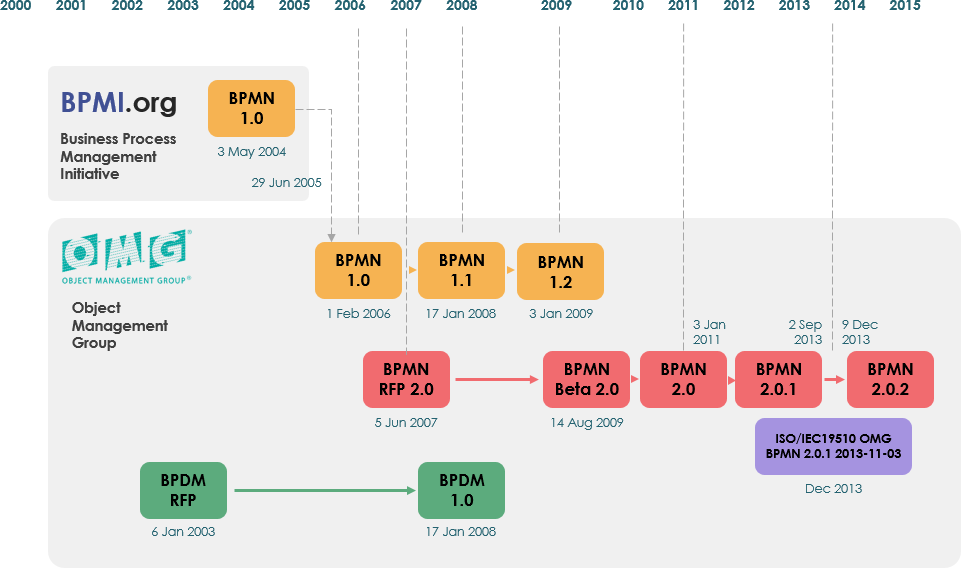
The Evolution of BPMN Originally developed by the Business Process Management Initiative (BPMI), BPMN has witnessed significant growth and development:
- The BPMN 1.0 specification was made available to the public in May 2004, following more than two years of collaborative effort by the BPMI Notation Working Group.
- OMG (Object Management Group) released a BPMN Specification document in February 2006.
- BPMN 2.0 was introduced in 2010, with the finalized specification released in December 2013.
- The most recent version, BPMN 2.0.2, has received formal recognition as the 2013 edition standard by the International Organization for Standardization (ISO) under ISO/IEC 19510.
Core Elements in BPMN
A Business Process Diagram (BPD) in BPMN is constructed using a set of graphical elements designed for simplicity and familiarity, resembling traditional flowchart diagrams. These elements were thoughtfully chosen to ensure they are distinguishable and employ shapes widely recognized by modelers.
Intuitive Symbols For instance, activities are represented by rectangles, and decisions take the form of diamonds. It’s important to highlight that BPMN’s development aimed to create an uncomplicated method for crafting business process models while accommodating the inherent complexity of business processes.
Balancing Simplicity and Complexity The approach adopted to strike a balance between simplicity and complexity entailed:
- Categorizing Graphical Elements : Organizing notation’s graphical aspects into distinct categories to provide a concise set of categories. This allows BPD readers to readily identify basic element types and comprehend the diagram.
- Variation within Categories : Within these basic element categories, the notation permits additional variation and information. This accommodates the needs of complex processes without fundamentally altering the diagram’s fundamental appearance.
Four Fundamental Categories BPMN defines four core categories of elements, each serving a unique purpose:
- Flow Objects
- Connecting Objects
Flow Objects Within a BPD, the core elements known as Flow Objects are intentionally limited to three primary types. This restriction simplifies the modeling process, sparing modelers from the need to learn and recognize numerous shapes. The three Flow Objects include:
- Event : Represented by a circular shape, Events signify occurrences or incidents that transpire within a business process. These Events impact the process flow and typically have a cause (trigger) or a consequence (result). Events feature open centers to accommodate internal markers distinguishing various triggers or results. Events are categorized into three types based on when they affect the flow: Start, Intermediate, and End Events.
- Activity : Displayed as a rounded-corner rectangle, Activities serve as a generic term for the work performed by the company. Activities can be atomic (indivisible) or nonatomic (compound). They encompass two primary types: Tasks and Sub-Processes. Sub-Processes are discernible by a small plus sign situated at the bottom center of the shape.
- Gateway : Recognizable as the diamond-shaped symbol, Gateways are instrumental in governing the branching and merging of Sequence Flow. Gateways determine conventional decisions, as well as the forking, merging, and joining of paths within the process. Internal markers are employed to indicate the type of behavioral control exercised by Gateways.
By adhering to these fundamental elements, BPMN provides a clear and structured framework for modeling complex business processes, making it accessible to both business analysts and technical experts.
Flow Object Summary

Connecting Elements in BPMN
To construct the fundamental framework of a business process in BPMN, the flow objects are interlinked within a diagram. This connectivity is facilitated by three essential Connecting Objects:
Sequence Flow A Sequence Flow is visually represented by a solid line adorned with a solid arrowhead (refer to the figure on the right). Its primary role is to illustrate the order, or sequence, in which activities within a process will be executed. It’s important to note that BPMN typically avoids the use of the term “control flow.”
Message Flow Message Flow serves as a symbol for the exchange of information across organizational boundaries. It can be linked to pools, activities, or message events. Message Flow is a versatile connector, adaptable to various elements within the diagram. Furthermore, Message Flow can be enriched with an envelope icon, symbolizing the content of the message being conveyed.
Association Annotations are an integral part of BPMN, allowing for the inclusion of supplementary information essential for documenting the process. Associations serve as connectors that enable the display of additional context or relevant details directly on the diagram, enhancing its comprehensibility.
These three Connecting Objects play a pivotal role in shaping the structure of BPMN diagrams, facilitating the clear representation of process sequences, information exchanges, and contextual documentation.

Swimlanes in BPMN
In the realm of process modeling methodologies, swimlanes emerge as a valuable concept for systematically categorizing activities within a diagram. This categorization helps delineate distinct functional capabilities or responsibilities. BPMN seamlessly incorporates the notion of swimlanes, offering two primary constructs for this purpose.
These two essential BPD (Business Process Diagram) swimlane objects encompass:
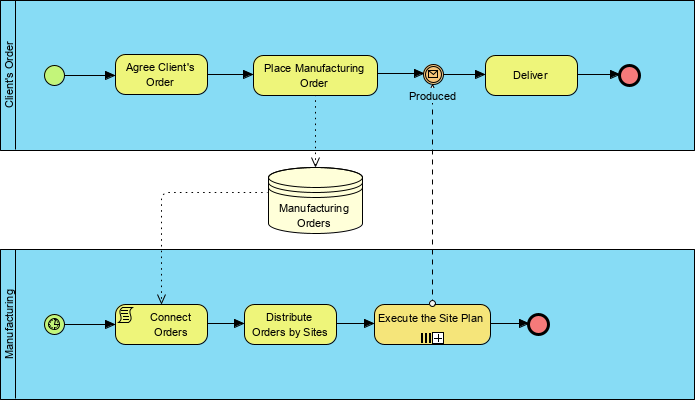
Pool A Pool serves a dual purpose as it represents a Participant within a Process while simultaneously serving as a graphical container for segregating a set of activities from other Pools (as depicted in the figure on the right). This segregation is often employed in scenarios involving Business-to-Business (B2B) interactions.
Lane Lanes function as sub-partitions residing within a Pool, extending the entire length of the Pool either vertically or horizontally (as illustrated in the figure on the right). Their role is to meticulously organize and categorize activities, providing a structured visual framework for process representation.
Incorporating swimlanes in BPMN facilitates the systematic organization and depiction of processes, enhancing clarity by effectively compartmentalizing different aspects of a process’s functional capabilities or responsibilities.
Artifacts in BPMN
BPMN was thoughtfully designed to offer modelers and modeling tools a degree of flexibility, enabling extensions to the core notation. This flexibility caters to the need for context customization, especially in modeling scenarios tailored to specific vertical markets (e.g., insurance or banking). Depending on the context of the business processes being depicted, any number of Artifacts can be seamlessly integrated into a diagram.
The current iteration of the BPMN specification introduces three pre-defined types of BPD (Business Process Diagram) Artifacts, which encompass:
Data Object Data Objects serve as a valuable mechanism for illustrating how data is either required or generated by various activities within the process. They establish connections to activities through the use of Associations, enhancing the clarity of data flow and dependencies.
A data store represents a repository where a process can either retrieve or deposit data, and this data persists beyond the immediate scope of the process.
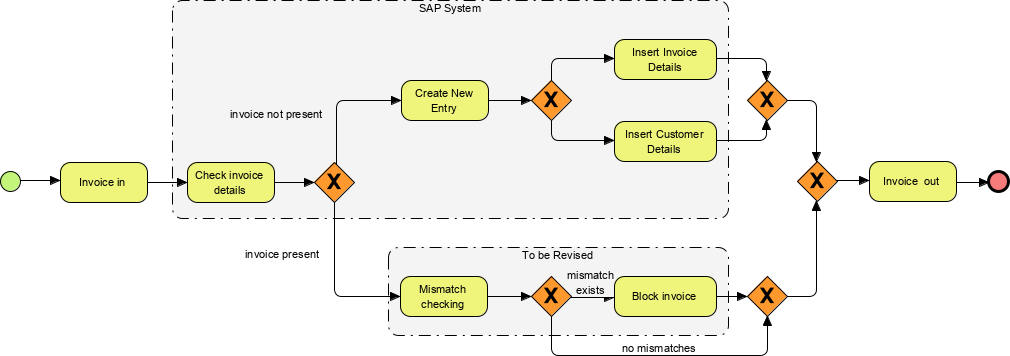
A Group is visually depicted as a rounded-corner rectangle enclosed by a dashed line (as illustrated in the figure to the right). This grouping serves purposes related to documentation or analysis, without any impact on the Sequence Flow.
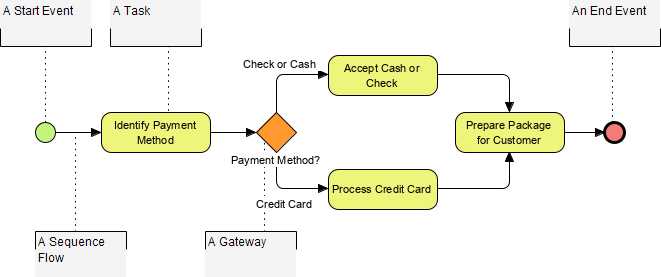
Annotations serve as a tool for modelers to furnish supplementary textual information for readers of a BPMN Diagram (as depicted in the figure to the right). In the following example, annotations are employed to elucidate BPMN elements:
BPMN Annotation
BPMN Notation: Simplified or Elaborate? As previously mentioned, even within the foundational categories of elements, there exists room for introducing additional variation and information. This accommodates the demands for complexity while preserving the essential visual characteristics of the diagram.
The event table below provides a comprehensive array of representations for events within BPMN. It showcases the integration of basic elements with additional variations, empowering BPMN events to handle complexity without substantial alterations to the core notation’s visual aesthetics:
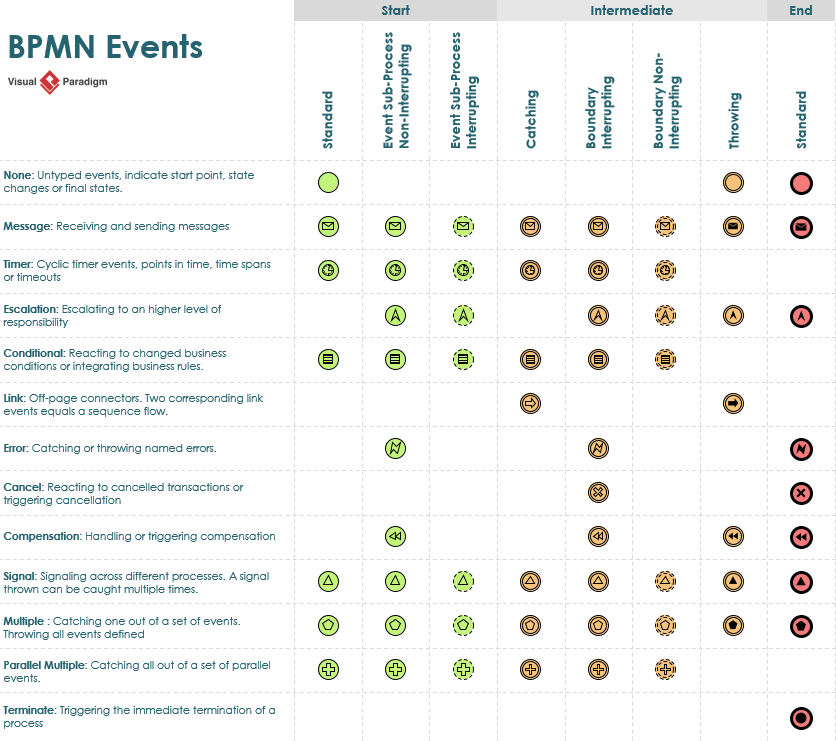
This article introduces readers to the fundamental principles and constructs of BPMN, equipping them with the knowledge needed to create clear and effective business process models. BPMN not only serves as a practical tool for process modeling but also fosters seamless collaboration and understanding among diverse stakeholders, making it an invaluable asset for organizations striving for operational excellence and continuous improvement.
BPMN achieves a delicate balance between simplicity and complexity. By categorizing graphical elements into specific types and allowing variations within these categories, BPMN enables modelers to capture intricate process details without sacrificing the clarity and familiarity of the notation. The discussion culminates in an exploration of how BPMN events can be adapted to support complexity while retaining the basic visual aesthetics of the notation.
Leave a Comment Cancel reply
You must be logged in to post a comment.

- Visual Paradigm Online
- Request Help
- Customer Service
- Community Circle
- Demo Videos
- Visual Paradigm
- YouTube Channel
- Academic Partnership

Published: 27 June, 2024 Contributors: Ivan Belcic, Cole Stryker
Process modeling is the practice of creating data-driven visual representations of key business processes. It gives organizations a common language with which they can understand and optimize workflows
If an organization wants to earn strong returns on its research and development investments, resolve IT issues with minimal downtime or create an accurate lead qualification workflow, it needs to understand these processes on an objective and comprehensive level. Even the business users directly involved in these processes might lack total transparency into exactly what happens every step of the way.
Business analysts and other stakeholders can gain end-to-end views of the current state of their business process lifecycle through process modeling. It is a business process management (BPM) technique that creates data-driven visualizations of workflows. These process models help organizations document workflows, surface key metrics, pinpoint potential problems and intelligently automate processes.
Download the study to explore Forrester’s findings and discover why continuous process optimization should be a business imperative for your organization.
Automate to elevate
A process model is a graphical representation of a business process or workflow and its related subprocesses. Process modeling generates comprehensive, quantitative activity diagrams and flowcharts containing critical insights into the functioning of a particular process, including:
Events and activities that occur within a workflow.
Who owns or initiates those events and activities.
Decision points and the different paths workflows can take based on their outcomes.
Devices involved in the process.
Timelines of the overall process and each step in the process.
Success and failure rates of the process.
Algorithm-driven: Process models are produced by data mining algorithms that use the data contained within event logs to construct models of the workflows as they exist.
Objective: Because process models are based on quantitative data, they offer genuinely objective views of workflows as they exist in practice and include key data, metrics or events for more thorough process analysis.
By creating a flow diagram of its new account creation process, a software company might discover that a significant number of customers are abandoning the sign-up process because it takes too long. A model can even help the company pinpoint the exact stage at which these drop-offs occur.
Standardized: Process models typically use one of two standardized styles of graphical business process notation: business process modeling notation (BPMN) —also called business process model and notation—or unified modeling language (UML).
Within these notation systems, certain visual elements have universally recognized meanings when used in a process model. Whether an organization uses UML diagrams or BPMN diagrams, these standardized notation methodologies allow process models to be readily shared and read by anyone. Here's how different elements are represented within these diagrams:
Arrows represent sequence flows.
Diamonds represent decision points or gateways.
Ovals represent the beginnings and endpoints of processes.
Rectangles represent specific activities within a workflow.
Swimlanes identify who owns which components of a process.
Event logs and process mining are essential business process modeling tools that underpin modern business process modeling techniques.
Most enterprise IT systems maintain event logs . These event logs are digital records that automatically track state changes and activities, known as events , within the system. Anything that happens within a system can be an event. Here are some common event examples:
A user logs in.
A user updates a record.
A user submits a form.
Information is transferred between systems.
Event logs track both the occurrence of events and information surrounding these events, such as the device performing an activity and how long the activity takes. Event logs act as the inputs during the production of process models.
Process mining is the application of a data-mining algorithm to all of this event log data. The algorithm identifies trends in the data and uses the results of its analysis to generate a visual representation of the process flow within the system.
This visual representation is the process model. Depending on the process targeted for modeling, process-mining algorithms can be applied to a single system, multiple systems or entire technological ecosystems and departments.
Business process modeling shouldn’t be confused with process mapping and process mining . Process maps are manually created based on employee reports and provide higher-level workflow process diagrams. Process mining analyzes organizational data to produce process models, which use that data to create present more objective workflow diagrams .
Process models offer transparency into company workflows, making them a key business process management tool. Process models can be used in any scenario that requires analyzing business processes. These are some of the most common use cases:
A single process model can contain a wealth of workflow data, allowing team members to analyze a workflow from multiple perspectives. Business analysts often use process modeling to highlight these workflow components:
- Control flow: The order in which steps and commands occur within a process is known as its control flow. A process model depicts a flowchart of a process so that a team can see what steps are taken and when. This perspective also helps the team identify any dependencies between steps.
- Organization: A process model can capture who is involved in a process—including people, teams, systems and devices—and how they interact with each other. This perspective illuminates the connections between people and systems that form the organizational social network. In this way, a process model offers insight into how various components of a business function together.
- Time: A process model can record how long a process takes, overall and how long each step takes, allowing the team to identify delays, slowdowns and bottlenecks within the workflow.
- Case: A process model can offer a general view of how a workflow plays out, or it can reflect a particular case—or instance—of a workflow. Teams often use this case perspective to analyze anomalous process outcomes. For example, if a specific instance of a workflow results in lower-than-average outcome quality, teams can isolate exactly what went wrong.
Process models accurately reflect existing workflow inefficiencies and redundancies, simplifying the identification of opportunities for process optimization. When workflows have been optimized, businesses can use process modeling to standardize workflows across the entire enterprise.
The model acts as a template for how processes should play out, helping to ensure that every team and employee approaches the same process in the same way. This leads to more predictable workflows and outcomes overall.
Process models can take the guesswork out of implementing and evaluating new business processes. By creating a model of a new process, business users can get a real-time look at how that workflow is performing, allowing them to make adjustments as necessary to achieve process optimization.
Process models can help companies track whether money and resource investments produce suitable returns. For example, by creating a model of the standard sales process, an organization can see how sales representatives are using the tools and systems at their disposal.
It might turn out that a certain tool is used much less frequently in the process steps than anticipated, in which case, the organization can choose to disinvest from the tool and spend that money on a solution the sales team uses throughout the entire process.
Process models transform complex processes into concrete images, simplifying the dissemination and discussion of processes throughout the organization, especially useful for standardizing project management. For example, if one department has an efficient process for troubleshooting technical problems, the business can create a model of this process to guide implementation on an organization-wide scale.
Process modeling arms an enterprise with objective business intelligence that supports more informed decisions for resource allocation, process improvement and overall business strategy. With a clear view of processes, enterprise teams can ensure that workflows consistently yield optimal results. As a result, operating costs are lower, revenue is higher and business outcomes are stronger.
With process modeling, companies can:
Without a process model, teams are limited to discussing and analyzing workflows in qualitative and subjective terms.
As a result, teams might not accurately understand their workflows. They might make business decisions based on misunderstandings, assumptions or incomplete knowledge.
Process modeling grants access to quantitative workflow data, including success and error rates, allowing for a more rigorous analysis of business processes.
Before a process can be automated, an organization needs a clear understanding of how that process plays out in reality, including the business logic underpinning each decision point.
A process model illuminates both the way that a workflow unfolds and the relationships between events, actors, tools and systems within and between processes.
This viewpoint helps a team document the process itself and the business rules that guide its execution. This information simplifies the process of effectively automating workflows the first time, and then iterating for continuous improvement.
Process models provide organizations with a simpler way to identify opportunities for process optimization. As a result, business processes require less investment to maintain and generate positive outcomes at a lower cost.
Discover solutions that deliver intelligent automation quickly with low-code tools.
IBM Process Mining helps businesses make faster, more informed decisions for process improvement through data-driven insights.
Boost ROI with full-featured AI-driven Robotic Process Automation.
Learn how restaurant chain Primanti Brothers is modernizing back-office processes with a Robotic Process Automation bot.
Discover how organizations are employing predictive approaches, process mining tools and implementing tech-infused workflows to achieve data-driven innovation.
Simplify the identification of opportunities for process optimization by providing organizations with process models.
Discover how high-impact automation can help make your IT systems more proactive, business processes more efficient and people more productive.

Business Model Canvas – Comprehensive Guide with Examples
The Business Model Canvas (BMC) is useful for people looking to create a model or adapt the structure of their organization or development idea. It enables you to create value out of new ideas. Simply having a good idea for a new product or service is not enough if you can’t answer some key questions about how to take it forward.
The Business Model Canvas offers a concise tool for thinking through the business and keeping the key points highly visible to you, your team and your other stakeholders. It is a graphical, one-page framework that allows you to design, describe and/or challenge your business model.
Leading global companies such as MasterCard, General Electric, Adobe, and Nestlé, use the Canvas to manage strategy or create new growth engines, while start-up businesses, schools, development organizations, and other enterprises use it in their search for the right business model.
Why Use Business Modeling Canvas?
It is often very difficult to think through every single influence on your ideas and plans: how can you explain what you do, why you do it and how you do it in a simple and structured way? When you are planning or looking back at an initiative it is useful to look at how you are doing things now and how you could do them better in the future.
To get the most value from the strategic nature of the inputs and outputs, you may want to consult with many other people, both within and outside your organization. When you come to use the Canvas, you’re likely to make several revisions until you are happy with it. Business Model Canvas creates a complete overview of your strategy which includes:
- The products you should offer
- The people you should focus on
- The paths you should take
- The resources you should use to make your idea as successful as possible
Taking the time to sketch out your model and explore it in detail enables you to identify both its advantages and drawbacks so that you can make an informed decision about whether or not to commit resources to take it forward.
The Structure of Business Model Canvas
The Business Model Canvas is a single-page overview that lays out both what you do (or want to do) and how you go about doing it, enabling structured conversations around management and strategy. This visual format is useful for both existing and new organizations and businesses.
Look at the Business Model Canvas template below; you will see nine key elements. Let’s take a few moments to understand each of these elements in the sections below:
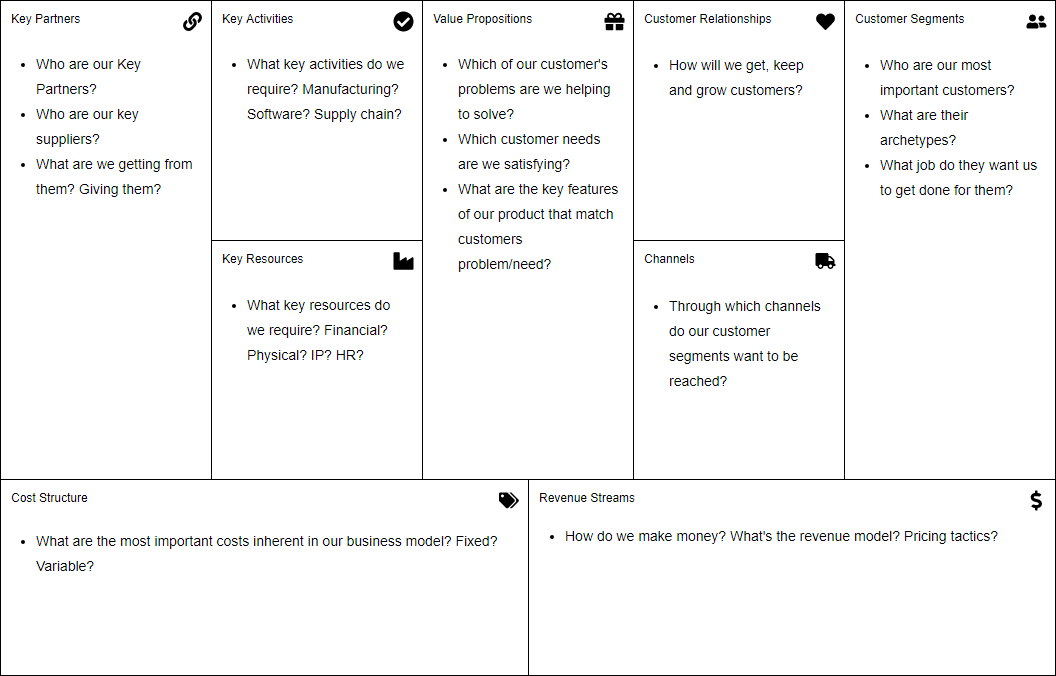
1. Value Propositions : these are the different products and services which the business offers and which create value in each of the customer segments. Value proposition enables the customers to go for the product or service that is being offered as compared to the others. It is the one that attracts the customers and which makes the customers return. Some of the characteristics of value proposition include the newness, customization, uniqueness, and quality of the product or service. Price, design, brand, and accessibility are some of the key attributes of a value proposition.
Guiding Questions:
- What is unique that is available to customers?
- Why do customers buy from your business?
- Which classes are you creating values for?
- What unique service do you offer to your customers?
2. Customer Segments : This refers to the market which the service or product is offered to. A customer segment is that part of the market targeted by the organization. In any business model, customers are at the center of the business. There is a need to classify these customers, identify their needs and satisfy the customers for the business to survive. There are different customer segments which include based on different market characteristics.
- Who are the major customers of your business?
- What do customers say about your business?
- Are there any important customers?
3. Channels : These are the means by which the goods and services reach customers. Recently modern technologies have been used to easily and effectively reach customers.
- What channels are used to reach customers
- What alternatives are available to reach customers?
4. Customer Relationships : this involves all the activities that are undertaken to motivate and impress customers. Different market segments have different relations which the business should identify and maintain.
- What is been done to maintain customers
- What incentives and rewards are available for customers?
5. Revenue Streams : includes the means and sources that the business gets income from. These are the different ways that an organization would use to get revenue. Examples could be advertising, asset sale, subscription fees and renting.
- What are the main revenue source
- What is the business doing to get more income?
6. Key Resources : Key resources are the main utilities that the business has and uses to achieve customer satisfaction. It includes the equipment, pool of assets and other products that the business uses to ensure that there are production and service delivery.
- What are the main assets and resources for the business?
- What do you need to be able to satisfy customers’ needs?
7. Key Partnerships : includes all the key stakeholders that the business requires to be able to perform its activities. These may include manufacturers, suppliers and other businesses in the same category of other entities that a business can collaborate with.
- Who are the main stakeholders?
- What are the motivations for the partnerships?
8. Key Activities : these are the major functions of the organization. These are key activities that a business engages in, to ensure survival in the market.
- What are the main functions of the business?
- What does your business do?
9. Cost Structure : describes all costs incurred to operate a business model. Such costs include the costs incurred during the creation and delivery of value, enabling customer value and getting income.
- What are the business’ major cost drivers? How are they linked to revenue?
- What are the main expenses for the business?
Business Model Canvas Example – Uber Platform
Business Model Canvas provides a holistic view of the business as a whole. It is crucial when it is used in a comparative analysis regarding the impact of company investments and other contributing factors.
Be creative and write your ideas down on colorful memo notes using the Business Model Canvas tool.
- Create a blank Business Model Canvas.
- Choose a memo you wish to use then drag and drop it onto the drawing canvas.
- Customize the memo and sticky via the Format panel.
- When you are done, save it (File > Save as) to our cloud repository for future access. You can also export your diagram into an image (PNG, SVG, JPG, PDF and more) and share it with your co-workers.
Business Model Canvas helps you discover who your clients are, search for a solution for your target customers, and explore what they are interested in and why they would choose your product. In this Business Model Canvas example below, you can see the Uber segmentation is also geo-demographic as the service seems to employ drivers who live in areas with the highest unemployment rates.
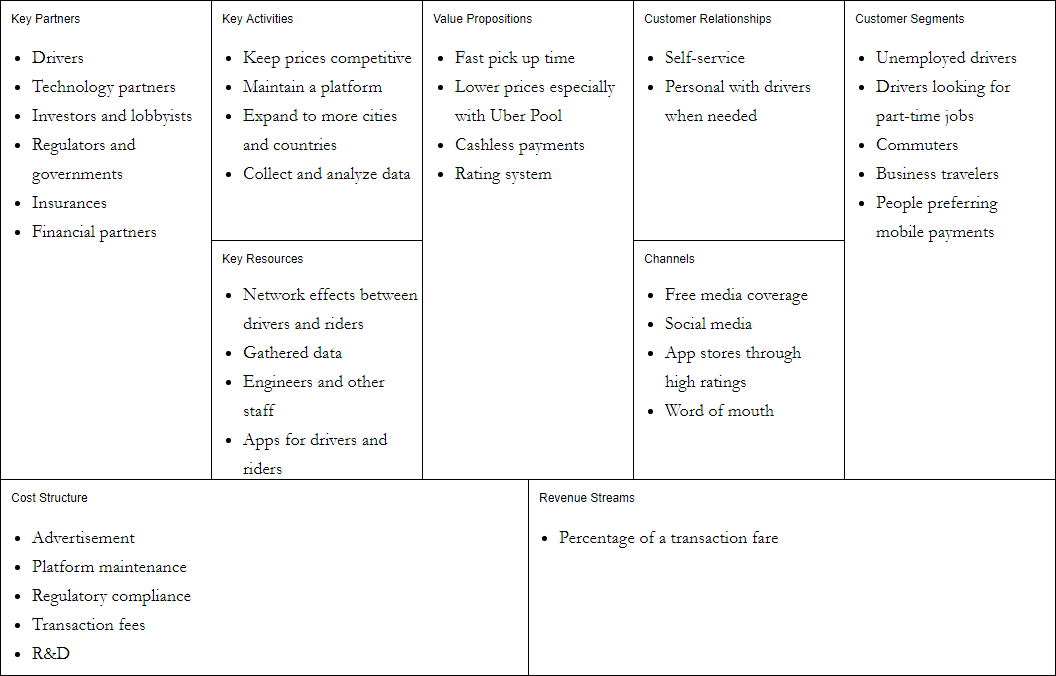
Edit this Diagram
©2024 by Visual Paradigm. All rights reserved.
- Terms of Service
- Privacy Policy
- Security Overview

IMAGES
VIDEO