
106+ Market Research Statistics: Market Size, Trends & Growth
Dive into the power of market research statistics, your compass in a dynamic business world. Learn how data-driven insights transform challenges into opportunities, guiding your path to resilience and growth.
Top Stats At A Glance
- The global market research industry generates more than $118 billion in annual revenue. 1
- Pharmaceutical companies account for 16.6% of global market research spending . 1
- 89% of market research suppliers and clients regularly use online surveys. 2
- 23% of organizations don’t have a clear market research strategy. 3
- 71% of market researchers are investing in CX software. 3
In the fast-paced realm of business, where change is constant and competition is fierce, market research statistics serve as the guiding stars for successful enterprises.
These statistics are the pulse of consumer behavior, industry trends, and strategic opportunities, providing businesses with the insights needed to navigate complexities and make informed decisions. This article explores the pivotal role of market research statistics in today's dynamic landscape.
Do you know? 👇🏻
What market share does the United States hold for market research?
The United States has a 53% market share in the market research industry.
From decoding consumer preferences to staying ahead of competitors, we'll uncover how leveraging statistical data can be a game-changer for businesses aiming not just to survive but to thrive in the modern marketplace. Join us as we unravel the transformative potential of data-driven decision-making.
General Market Research Industry Statistics 💨
Market research trends 📈, market research approaches 📝, wrapping up 🎁.
This section delves into the overarching trends, shifts, and dynamics that shape the global market research industry. Beyond the numbers, it unravels the intricate tapestry of challenges, successes, and the pivotal role market research plays in guiding business decisions.
- The global market research industry boasts an annual revenue exceeding $118 billion , with the United States alone contributing $62.64 billion to this total. 1
- Demonstrating a remarkable upward trajectory, global market research revenue has surged by 358% since 2009. 1
- Nielsen, securing its position as the leading market research company for the 6th consecutive year, reported $5.24 billion in revenue. 1
- Following closely, IQVIA secured a strong position as a top performer with $5.21 billion in revenue. 1
- Gartner demonstrated impressive financial performance, reporting $4.73 billion in revenue. 1
- SalesForce performed well, achieving a revenue of $3.9 billion . 1
- Adobe Systems also stood out as a top performer, with reported revenue of $3.87 billion . 1
- The United States dominates the market research industry with a substantial 53% market share, leaving the United Kingdom as its closest competitor with a 9% market share. 1
- Notable global market shares include China ( 3% ), India ( 2% ), and Australia ( 2% ), while the rest of the world collectively contributes 31% to the overall market. 1
- A significant portion, 20% of global market research spending , is allocated to CRM and customer satisfaction surveys. 1

- The majority, over 70% , of market research spending focuses on five key areas. 1
- The largest portion, 20.7% , is allocated to CRM and customer satisfaction surveys.
- User experience surveys account for 14.2% of market research spending .
- Audience research is a significant focus, representing 13.4% of the total spending .
- Usage and behavioral studies contribute significantly, comprising 11.7% of market research spending .
- Market measurement is also a priority, accounting for 11.6% of the overall spending .
Key Areas Of Market Research Spending
- Pharmaceutical companies take the lead, accounting for 16.6% of global market research spending . 1
- The primary contributors to market research spending are pharmaceutical companies ( 16.6% ), media and entertainment groups ( 15.5% ), and consumer goods producers ( 14.9% ). 1
- Other contributors include research institutes ( 1.8% ), tourism and recreation ( 1.6% ), and non-profit organizations ( 0.9% ). 1
In the realm of market research
70% of buyers prioritize business knowledge as a top skill for development, a sentiment shared by 56% of suppliers.
- Despite the industry's dynamism, 23% of organizations lack a clear market research strategy, and 26% of market researchers identify budget constraints as a hindrance to their strategies. 3
What is the global annual revenue of the market research industry, and how has it evolved over the years?
The global market research industry generates over $118 billion in annual revenue, reflecting a remarkable 358% increase since 2009.
Which country holds the largest market share in the market research industry, and what is the significance of its dominance?
The United States commands a substantial 53% market share in the market research industry, surpassing its closest competitor, the United Kingdom, which holds a 9% market share .
How is market research spending allocated across different sectors, and what are the key areas that attract the majority of investment?
Over 70% of all market research spending is directed towards five key areas: CRM and customer satisfaction surveys ( 20.7% ), user experience surveys ( 14.2% ), audience research ( 13.4% ), usage and behavioral studies ( 11.7% ), and market measurement ( 11.6% ).
Embarking on an exploration of Market Research Trends opens a window into the ever-evolving landscape where insights are gleaned and strategies are honed. In this section, we delve into the dynamic shifts that shape the methodologies and approaches within the market research sphere.
A substantial 90% of market researchers express regular utilization of online surveys. 4
- Industry experts predict a steady annual growth of 16% in the popularity of the online survey market until 2026. 4
- In contrast, only 60% of market researchers report regular use of mobile surveys. 4
- A significant 80% of market researchers express interest in acquiring best practice solutions for multicultural insights, research, and strategy. 5
of market researchers indicating increased usage of online/video focus groups compared to three years ago.
- Moreover, 90% are utilizing consumers' online video submissions and in-depth video interviews more frequently than in the past three years. 6
- A noteworthy shift is observed, with over half of market researchers estimating a decrease in their reliance on full-service research vendors. 7
- The inclination toward Do-It-Yourself (DIY) tools is prominent, as 70% of market researchers express a likelihood of transitioning to more DIY tools in the coming year. 7
- Despite a continued demand for market research, 56% of companies grapple with limited or shrinking budgets. 7
- The industry undergoes transformation as 60% of market researchers acknowledge that automation accelerates result delivery. 8
- Cost reduction benefits are reported by 50% of market researchers as a direct outcome of automation integration. 8
- A strong consensus of 80% of market researchers predicts the continued growth of automation as a prominent trend in the industry. 8

How prevalent are online surveys in current market research practices, and what is the projected growth of the online survey market?
Online surveys are extensively utilized, with nearly 90% of market researchers reporting regular use. The online survey market is expected to experience a robust 16% annual growth through 2026.
What level of interest exists among market researchers regarding multicultural insights, and how is this reflected in current industry trends?
A significant 80% of market researchers express interest in learning best practice solutions for multicultural insights, research, and strategy, indicating a growing focus on diverse perspectives within the industry.
How is the industry responding to the trend of increasing automation in market research, and what benefits do market researchers associate with this shift?
Automation is reshaping market research, with 60% of researchers leveraging it to deliver results faster, 50% experiencing cost reduction benefits, and an overwhelming 80% foreseeing continued growth in this transformative trend.
As technology evolves, so do the tools at the disposal of market researchers, and this journey through approaches illuminates the varied paths they navigate in the pursuit of comprehensive understanding.
- A significant 89% of both market research suppliers and clients regularly employ online surveys in their methodologies. 2
- Mobile surveys emerge as a widely adopted approach, with 60% of both clients and suppliers incorporating them into regular use. 2
- Proprietary panels gain prominence, with 45% of clients and suppliers reporting regular utilization of this market research approach. 2
- Online communities play a significant role, with 31% of clients and suppliers regularly employing them as part of their market research strategies. 2
- Online in-depth interviews conducted via webcam are a prevalent choice, with 41% of both clients and suppliers routinely employing this method.
- Online focus groups conducted through webcam interactions are widely used, with 40% of clients and suppliers regularly engaging in this qualitative market research approach.
- Online communities play a significant role, with 35% of clients and suppliers routinely utilizing them for qualitative market research.
- Telephone in-depth interviews constitute a notable approach, with 31% of both clients and suppliers incorporating them into their qualitative research strategies.
- In-person focus groups remain relevant, with 31% of clients and suppliers regularly opting for this traditional qualitative research method.
Utilization Of Qualitative Market Research Approaches
- The emergence of mobile-first surveys is noteworthy, with 64% already incorporating this technology, and an additional 13% considering its adoption in the near future. 2
- Customer surveys exhibit a 33% average response rate, with in-person surveys leading with the highest response rates at 57% . Conversely, in-app surveys perform less favorably with just a 13% response rate. 9
- A substantial 56.6% of global survey responses originate from mobile devices, surpassing the 40.2% from non-mobile users. 9
- Post the peak in May 2020, less than 2% of contemporary surveys make mention of the COVID-19 pandemic. 8
- A significant 71% of market researchers are investing in Customer Experience (CX) software, with other top investment areas including online consumer panels ( 69% ), market research online communities ( 63% ), and product testing software ( 62% ). 3
What is the prevalence of online surveys in market research, and how do they compare to other approaches?
Online surveys dominate market research approaches, with 89% of both suppliers and clients regularly utilizing them. Additional noteworthy approaches include mobile surveys ( 60% ), proprietary panels ( 45% ), and online communities ( 31% ).
How do different survey types vary in terms of response rates, and what are the preferred methods among respondents?
In-person surveys exhibit the highest response rates at 57% , outperforming other types such as mail surveys ( 50% ), email surveys ( 30% ), online surveys ( 29% ), and telephone surveys ( 18% ). In-app surveys have the lowest response rate at 13% .
What emerging trends are shaping market research, and how are researchers adapting to technological advancements?
A notable trend is the rise of mobile-first surveys, with 64% already incorporating this technology. Additionally, 56.6% of global survey responses come from mobile devices. Beyond survey methods, 71% of market researchers are investing in Customer Experience (CX) software, indicative of the industry's embrace of technological advancements.
In the dynamic world of market research statistics, the prevalence of online surveys, the rise of mobile-first approaches, and strategic investments in Customer Experience (CX) software paint a picture of an industry navigating consumer trends and technological shifts.
These numbers aren't just data; they signify an adaptable industry shaping the strategies of the future. As we wrap up this exploration, market research stands as a powerful tool, continuously innovating in the ever-evolving landscape of business decision-making.
- Market Research Services Global Market Report by Globenewswire
- BUSINESS & INNOVATION by Greenbook
- Market Research Trends by Qualtrics
- Market Research Industry by Statista
- A Diversity Tool for Market Research and Insights Professionals by Medium
- Market Research Transcription Services by Verbit
- Market Research Survival Guide by Surveymonkey
- Marketing Research And Automation Can Co-Exist by Quirks
- What’s The Average Survey Response Rate? by Pointerpro
Subscribe to our newsletter
Subscribe to be notified of new content on marketsplash..
Find Keyword Ideas in Seconds
Boost SEO results with powerful keyword research
19 Key Market Research Statistics
Written by Backlinko Team In collaboration with Semrush

Market research is a growing multi-billion-dollar industry.
Brands leverage market research insights to introduce customer-focused offerings and improve their experiences.
From mobile-first surveys to social media analytics, researchers have access to a growing toolkit helping companies make data-driven business decisions.
Here’s a breakdown of what you’ll find on this page:
- Market Research Industry Statistics
- Market Research Methods Statistics
- AI in Market Research Statistics
Market Research Statistics (Highlights)
- The global market research industry is forecasted to bring in $140 billion in revenue in 2024.
- Online/mobile quantitative research services accounted for 35% of worldwide revenues of market research companies.
- Around 47% of researchers worldwide state that they use AI regularly in their market research activities.
- Online surveys rank as the most used quantitative method among market research professionals with 85% of respondents who say they use this method regularly.
- Online in-depth interviews with webcams rank as the most used qualitative research method, with over one-third ( 34% ) of researchers using it regularly.
1. Market Research Industry Statistics
This section presents key statistics to show market research industry revenues, leading players in the industry and revenue breakdown by market research services.

- Between 2021 and 2024, the market research industry grew by 37.25% from $102 billion to $140 billion – ESOMAR

2. Market Research Methods Statistics
There’s a growing number of market research methods from traditional surveys to eye tracking available to market research professionals. In this section, we’ll cover recent stats on most used market research methods.

- More than 6-in-10 (62%) researchers say that their “company depends on their research and insights significantly” – Qualtrics
- A majority of researchers have reported an increase in their budgets allocated for customer experience (CX) research (53%), consumer trends (52%), UX research (51%), qualitative research (51%) and brand strategy (50%) – Qualtrics
3. AI in Market Research Statistics
AI is disrupting nearly every industry and job function. Market research is no exception and there are various AI use cases to apply in the everyday work of market researchers. We’ll explore the latest stats on AI adoption rate among market researchers in this section.

- The vast majority (73%) of researchers worldwide claim they’re “very confident” or “extremely confident” on how to apply AI to their market research activities – Qualtrics
- Around 1-in-4 researchers state they’re concerned about AI impact outpacing their personal or team skills – Qualtrics
That’s it for my list of market research statistics.
While market research has been around for a while, it has been undergoing constant transformation. It will be interesting to see how AI impacts market research projects.
We update this list of statistics from time to time so feel free to check it later for new insights.
- Media Center
- E-Books & White Papers
- Knowledge Center
Key Facts About the Market Research Industry
by Sarah Schmidt , on October 10, 2022

In this data-driven blog post, we’ll take a look at key statistics and expert analysis from a variety of new reports covering the global market research industry. Read on to gain a quick overview of the industry’s performance and important new trends to watch.
Market Sizing and Forecast
The global market research services market increased from $69.6 billion in 2016 to $76.37 billion in 2021 at a compound annual growth rate (CAGR) of 1.87 percent, according to a recent report by The Business Research Company .
An even higher growth rate is expected in the future. The global market research services market is forecast to grow from $76.37 billion in 2021 to $108.57 billion in 2026 at a CAGR of 7.29 percent.

The Role of Market Research
Companies in this industry gather, analyze, and present marketing and public opinion data. They conduct qualitative and quantitative research on behalf of clients to identify the needs and preferences of specific demographics or consumer groups. These insights can help companies customize their products, services, and marketing efforts to fit the intended target market.
In addition, the market intelligence that research firms provide can help clients make broad strategic decisions such as how to expand business operations, enter new markets, or establish distribution channels effectively.
Top Market Research Companies
Leading market research companies identified by First Research, Inc , include:
- Forrester Research
Key Market Drivers
Demand for market research services is driven by the strength of the economy and corporate profits. When profit margins rise, corporations seek out the help of market research companies to identify avenues for growth and improve their product and service offerings.
The U.S. Market Research Industry
From 2014 to 2019, the U.S. market research industry grew at a strong pace, propelled by increasing expenditures on research and development and internet advertising, according to a report by IBISWorld . Acquisitions were widespread among leading industry players, and large advertising firms also acquired market research companies to expand their portfolio of services.
As noted by First Research, the U.S. market research industry is known to be concentrated. The top 50 companies generate about 60% of industry revenue. “Large companies have advantages in providing a variety of research and ancillary services to large customers, and in achieving economies of scale in marketing and computerized operations,” according to First Research. “Small companies can compete successfully by specializing in a research methodology or in emerging niche knowledge areas.”
U.S. Revenue Forecast to 2029
The U.S. industry for business intelligence, market research, and opinion polling is expected to reach $24.96 billion by 2029. For complete benchmarking of the industry and its top companies, see a 58-page report published by Plunkett Research in September 2022 .
Market Research Trends to Watch
The rising use of the internet among consumers and advertisers created an opening for new market research companies to enter the market and prompted some established firms to adopt more innovative methods.
In the future, increasingly complex data analysis and changing consumption activity is expected to drive the demand for consumer market research, but some headwinds remain.
“Instituted interest rate hikes and increases in commodity prices are projected to put slight downward pressure on corporate profit growth, which typically has a relatively direct downstream impact on advertising and R&D expenditure,” according to IBISWorld.
However, the uncertainty created by supply chain and inflation pressures will also drive a continued need for “greater granularity” in market data, according to Freedonia Custom Research , as clients refine datasets and assumptions “that may have changed over the last 18-24 months that were fairly consistent in the past.”
Where to Find Out More
Whether you are interested in media buying agencies, public opinion polling, or statistical services, MarketResearch.com offers a variety of reports covering different market segments and geographical areas. Search our website to find out more.
To keep up with the latest industry trends, subscribe to the MarketResearch.com blog .

About the Author : Sarah Schmidt is a Managing Editor at MarketResearch.com, a leading provider of global market intelligence products and services.

About This Blog
Our goal is to help you better understand your customer, market, and competition in order to help drive your business growth.
Popular Posts
- A CEO’s Perspective on Harnessing AI for Market Research Excellence
- 7 Key Advantages of Outsourcing Market Research Services
- How to Use Market Research for Onboarding and Training Employees
- 10 Global Industries That Will Boom in the Next 5 Years
- Primary Data vs. Secondary Data: Market Research Methods
Recent Posts
Posts by topic.
- Industry Insights (826)
- Market Research Strategy (272)
- Food & Beverage (134)
- Healthcare (125)
- The Freedonia Group (121)
- How To's (108)
- Market Research Provider (89)
- Manufacturing & Construction (81)
- Pharmaceuticals (79)
- Packaged Facts (78)
- Telecommunications & Wireless (70)
- Heavy Industry (69)
- Marketing (58)
- Profound (56)
- Retail (56)
- Software & Enterprise Computing (54)
- Transportation & Shipping (54)
- House & Home (50)
- Materials & Chemicals (47)
- Medical Devices (46)
- Consumer Electronics (45)
- Energy & Resources (42)
- Public Sector (40)
- Biotechnology (37)
- Demographics (37)
- Business Services & Administration (36)
- Education (36)
- Custom Market Research (35)
- Diagnostics (34)
- Academic (33)
- Travel & Leisure (33)
- E-commerce & IT Outsourcing (32)
- Financial Services (29)
- Computer Hardware & Networking (26)
- Simba Information (24)
- Kalorama Information (21)
- Knowledge Centers (19)
- Apparel (18)
- Cosmetics & Personal Care (17)
- Social Media (16)
- Advertising (14)
- Big Data (14)
- Market Research Subscription (14)
- Holiday (11)
- Emerging Markets (8)
- Associations (1)
- Religion (1)
MarketResearch.com 6116 Executive Blvd Suite 550 Rockville, MD 20852 800.298.5699 (U.S.) +1.240.747.3093 (International) [email protected]
From Our Blog
Subscribe to blog, connect with us.
- Skip to main content
- Skip to primary sidebar
- Skip to footer
- QuestionPro

- Solutions Industries Gaming Automotive Sports and events Education Government Travel & Hospitality Financial Services Healthcare Cannabis Technology Use Case NPS+ Communities Audience Contactless surveys Mobile LivePolls Member Experience GDPR Positive People Science 360 Feedback Surveys
- Resources Blog eBooks Survey Templates Case Studies Training Help center
Home Audience
Market Research Industry: Current Stats and Future Trends

The market research industry has grown steadily over the last five years. But innovations could rapidly increase potential market research revenue in the research industry in the future. What should companies in this Industry expect in the years to come? Here are a few market research stats and trends.
Here, we’ll look at key market research stats and trends from various new reports covering the market research industry. Read on to gain a quick overview of the Industry’s performance and important new trends to watch.
What is the market research industry?
The market research industry is a sector that focuses on gathering, analyzing, and interpreting data about markets, consumers, competitors, and various business-related trends.
Its primary goal is to provide valuable insights and information to businesses, organizations, and governments to make informed decisions about their products, services, marketing strategies, and overall business operations.
The global market research industry plays a crucial role in helping businesses understand their target audience, identify market opportunities, evaluate the potential demand for products or market analysis services, and assess the competitive landscape. It involves collecting and analyzing both qualitative and quantitative data to understand consumer behavior, preferences, attitudes, market trends, and dynamics.
The key drivers of market research demand
Companies that provide market research services help their clients gather and interpret information about individuals or organizations, with the insights (market size, competition, market need, consumer behavior, etc) leveraged to shape strategies and marketing/sales activities.
Also, studies like the 2018 Global Brand Health Report , where tech workers reveal the companies they want to work for and what they value in a job offer, are studies that are important to industries.
To arrive at their findings and infer insights, market researchers use a range of qualitative techniques such as in-depth interviews, focus groups, and ethnography, as well as quantitative techniques such as customer surveys, analysis of secondary data, and statistical/ analytical research methods. Here are the key drivers of market research demand:
- Speed: Researchers need results fast, and with faster results, one sees more evidence-based decision-making.
- Cost: Costs have always been an issue. Making decisions based on accurate research studies helps eliminate unnecessary costs.
- Quality: Quality is particularly important in market research when the current offering is not good enough.
SELECT YOUR RESPONDENTS
North America Dominates
- The market research stats and trends favor the U.S.
- According to a recent report by First Research Inc. , the market research industry globally produces $45 billion in revenue each year.
- Europe and the United States lead the industry overall. Other countries such as China, Brazil, Russia, and India are experiencing increasing demand for market research-related statistical services.

How is the industry performing in the U.S.?
The Market Research industry in the U.S. has undergone strong growth over the five years. They conduct qualitative and quantitative research on behalf of customers to determine the needs and choices of specific demographics or consumer groups.
This has been supported by the increase in research and development (R&D) and internet advertising expenditure, which have driven demand for industry services.
There are 44,000 establishments offering market research services in the United States. They generate approximately $23 billion in combined annual revenue. In this case, “establishments” refer to market research companies with a single location as well as units of multi-location companies.

2018 market research stats and trends
- Many of you know that 2016 gave way to wearable technology, big data, mobile research, and many more innovative market research trends.
- 2018 saw these trends grow, gaining traction, and we anticipate their growth further into 2019.

The future of market research is already here
According to the market research stats and trends, many of these industry trends have bubbled underneath the surface for the last few years. And are now ready to take center stage.
Getting a handle on the key trends for market research will position you well to assist your brand with sensible consumer insight. This keeps your organization competitive while building strong customer relationships that will endure for years to come.
LEARN ABOUT: market research trends
Also, expect to see more automation, standardization, and many claims about artificial intelligence. The key drivers of success for these systems are ease of use, speed, and cost. However, a key element in their success is the ability to leverage existing brands and reputations.
The market research industry is growing fast, and businesses now understand the importance of using data to make smart decisions. Market research tools play a crucial role in providing valuable insights to companies, helping them understand customers and the market better.
QuestionPro emerges as a key player in this changing landscape, offering a user-friendly platform that makes data collection and analysis easier. With automation and AI-powered features, QuestionPro simplifies the research process, saving time and effort for researchers.
It provides quick and accurate insights, enabling businesses to make informed choices. QuestionPro’s commitment to data security and compliance ensures that researchers can conduct ethical data collection, protecting the privacy of participants’ information. As the market research industry looks to the future, QuestionPro’s advanced analytics and A.I. capabilities will continue to shape its trajectory. Researchers can rely on QuestionPro to predict market trends and gain a competitive advantage.
With its user-friendly interface and dedication to providing meaningful results, QuestionPro remains a valuable asset for market researchers, empowering businesses to succeed in an ever-changing market.
FREE TRIAL LEARN MORE
Frequently Asking Questions (FAQ)
Key trends include AI-driven insights, mobile research, ethical data collection, and virtual reality integration.
Media rating services help measure the popularity and effectiveness of media content, providing valuable insights for businesses and advertisers.
MORE LIKE THIS

The Best Email Survey Tool to Boost Your Feedback Game
May 7, 2024

Top 10 Employee Engagement Survey Tools

Top 20 Employee Engagement Software Solutions
May 3, 2024

15 Best Customer Experience Software of 2024
May 2, 2024
Other categories
- Academic Research
- Artificial Intelligence
- Assessments
- Brand Awareness
- Case Studies
- Communities
- Consumer Insights
- Customer effort score
- Customer Engagement
- Customer Experience
- Customer Loyalty
- Customer Research
- Customer Satisfaction
- Employee Benefits
- Employee Engagement
- Employee Retention
- Friday Five
- General Data Protection Regulation
- Insights Hub
- Life@QuestionPro
- Market Research
- Mobile diaries
- Mobile Surveys
- New Features
- Online Communities
- Question Types
- Questionnaire
- QuestionPro Products
- Release Notes
- Research Tools and Apps
- Revenue at Risk
- Survey Templates
- Training Tips
- Uncategorized
- Video Learning Series
- What’s Coming Up
- Workforce Intelligence
Root out friction in every digital experience, super-charge conversion rates, and optimize digital self-service
Uncover insights from any interaction, deliver AI-powered agent coaching, and reduce cost to serve
Increase revenue and loyalty with real-time insights and recommendations delivered to teams on the ground
Know how your people feel and empower managers to improve employee engagement, productivity, and retention
Take action in the moments that matter most along the employee journey and drive bottom line growth
Whatever they’re are saying, wherever they’re saying it, know exactly what’s going on with your people
Get faster, richer insights with qual and quant tools that make powerful market research available to everyone
Run concept tests, pricing studies, prototyping + more with fast, powerful studies designed by UX research experts
Track your brand performance 24/7 and act quickly to respond to opportunities and challenges in your market
Explore the platform powering Experience Management
- Free Account
- For Digital
- For Customer Care
- For Human Resources
- For Researchers
- Financial Services
- All Industries
Popular Use Cases
- Customer Experience
- Employee Experience
- Net Promoter Score
- Voice of Customer
- Customer Success Hub
- Product Documentation
- Training & Certification
- XM Institute
- Popular Resources
- Customer Stories
- Artificial Intelligence
- Market Research
- Partnerships
- Marketplace
The annual gathering of the experience leaders at the world’s iconic brands building breakthrough business results, live in Salt Lake City.
- English/AU & NZ
- Español/Europa
- Español/América Latina
- Português Brasileiro
- REQUEST DEMO
Market Research Report
2021 market research global trends.
For market researchers, COVID-19 accelerated a transformation that’s been a decade in the making — and it will completely reshape the industry in the coming years.
In our first annual study into the state of the market research industry, we surveyed more than 2,000 market research professionals from 16 countries to better understand how the industry reacted to COVID-19 in 2020 and how the dynamics of market research have changed.
Explore how organizations are adapting their approach to market research and what their top priorities and challenges are for 2021 as they look to design the experiences people want next.
Download Now
In this report you’ll learn:.
- Key priorities for research leaders in 2021
- How technology is transforming how researchers work
- Market research’s role in helping organizations move forward
12,000+ brands and the top 100 business schools have switched to Qualtrics
Request demo.
Ready to learn more about Qualtrics?
Market Research Industry Statistics: Emerging Analysis Broadly
Updated · Sep 26, 2023
At Market.us Scoop, we strive to bring you the most accurate and up-to-date information by utilizing a variety of resources, including paid and free sources, primary research, and phone interviews. Our data is available to the public free of charge, and we encourage you to use it to inform your personal or business decisions. If you choose to republish our data on your own website, we simply ask that you provide a proper citation or link back to the respective page on Market.us Scoop. We appreciate your support and look forward to continuing to provide valuable insights for our audience.
Table of Contents
Introduction
Editor’s choice, market research industry statistics by size, market research industry statistics by key players, market research industry statistics by regional analysis, market research industry statistics by spending, market research industry statistics by methods, market research industry statistics by client response in sector, most demanded skills by market research clients, market research industry statistics by challenges.
Market Research Industry Statistics: The market research industry is a vital component of modern business strategy, serving as the “eyes and ears” of organizations by offering crucial insights into market dynamics, consumer behavior, and competition.
Its core functions encompass market analysis, consumer behavior analysis, competitor assessment, product development support, marketing optimization, and strategic planning.
Evolving with technology, it has transitioned from traditional data collection methods to online surveys, social media analysis, and AI-driven data analytics.
While facing challenges like data privacy and information overload, the industry also presents opportunities for specialization, ethical data practices, and advanced analytics, ensuring its continued importance in guiding businesses through a complex and data-driven marketplace.

- In 2022 , the global market research sector generated an impressive total revenue that exceeded $82 billion , representing growth of more than double compared to 2008 .
- In 2021 , North America played a dominant role in contributing to the industry’s revenue, contributing over half of the global total. Europe closely followed , accounting for approximately one-fourth of the global market share .
- Notable market research firms include Nielsen Holdings (USA), Kantar (UK), IQVIA (USA), Ipsos (France), and GfK Group (Germany)
- IQVIA led the industry in terms of revenue in 2021 .
- In traditional quantitative research methods, online surveys emerged as the most widely used globally in 2022, employed by over 90% of market research professionals .
- Concurrently, phone and face-to-face interviews constituted 80% and 39% of quantitative research methods .
- Regarding qualitative research techniques, online in-depth interviews stood out as the predominant approach, accounting for more than two-thirds of such research conducted in 2022.
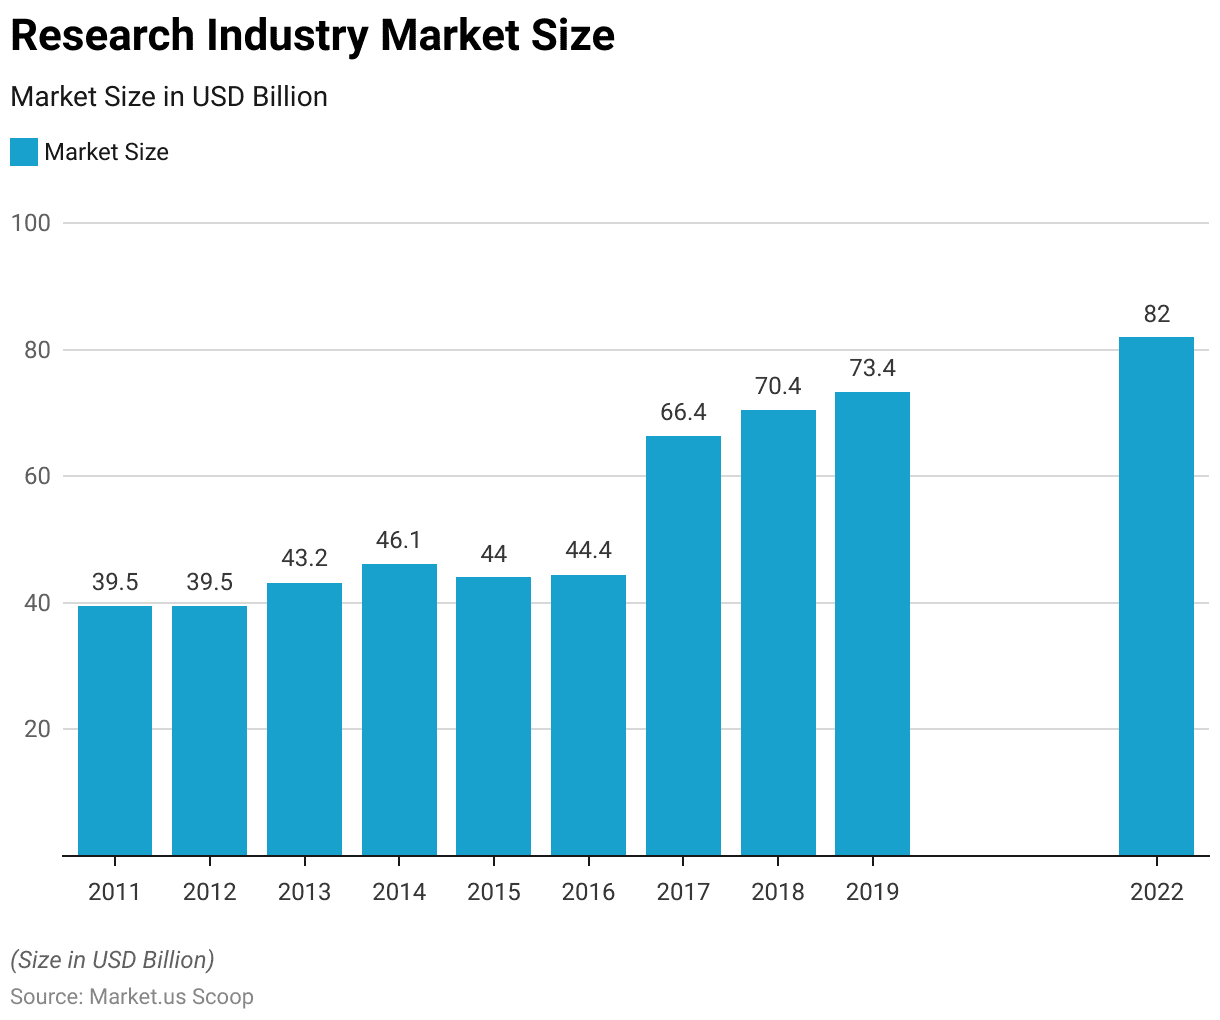
- The market research industry has experienced notable growth and fluctuations in market size over the past decade. In 2011, the market size stood at $39.47 billion, remaining relatively stable in 2012 at $39.52 billion.
- However, a significant uptick occurred in 2013, reaching $43.2 billion, followed by further growth in 2014, when it reached $46.09 billion.
- Subsequently, in 2015, there was a minor dip to $44.03 billion, but the market rebounded to $44.42 billion in 2016.
- The most substantial leap occurred in 2017, with the market size surging to $66.37 billion, showcasing remarkable growth .
- This upward trajectory continued in 2018, reaching $70.44 billion, and in 2019 when it peaked at $73.38 billion.
- Although 2022 figures indicate a market size of $82 billion, the industry’s journey over the past decade underscores its dynamic nature, with periods of expansion and stabilization shaping its evolution.
- Europe demonstrated the most substantial increase in market research revenue in 2021 , while Africa and the Middle East were the only regions that experienced a decline in growth rate .
(Source: Statista)
- Throughout 2021, Nielsen held its top spot as the leading market research company for the sixth year, reporting a revenue of $5.24 billion .
- Other prominent players in 2021 included IQVIA, which generated $5.21 billion; Gartner, with $4.73 billion; Salesforce, at $3.9 billion; and Adobe Systems, with $3.87 billion in revenue .
(Source: ESOMAR)
Nielsen Holdings
- Nielsen Holdings, a prominent market research company in the United States and a global leader in market measurement, achieved a global revenue of nearly $3.5 billion in 2021 .
- Nielsen’s revenue consistently grew from 2006 to 2017, reaching its peak at $6.57 billion in 2017 .
- However, it experienced a slight decline in 2018, 2019, and 2020, followed by a substantial decrease in 2021 .
- Operating under the name The Nielsen Company, it is headquartered in New York City, with approximately 6,200 full-time employees in the United States in 2021 .
- The company analyses consumer viewing and purchasing habits and serves notable clients like The Coca-Cola Company and Walmart .
- Despite recent reductions, the cost of revenue for Nielsen Holdings remained significant, exceeding $1.2 billion in 2021 .
- One of Nielsen Holding’s primary competitors, Ipsos , independently generated a global revenue of approximately $2.15 billion in 2021 .
Kantar Group
- Kantar Group, headquartered in London, serves as a data and consulting company with a global presence spanning 100 countries , engaging in diverse research activities.
- Market research is indispensable for businesses, equipping them with vital insights for effective strategy development tailored to their target markets.
- In 2021, Kantar secured its position as the fifth-largest global market research firm based on revenue .
- During that same year, the company generated nearly $606 million in market research revenue within the United States .
- When considering geographical breakdown, most of Kantar’s research revenue stemmed from regions outside the United States .
- Kantar achieved a remarkable global research revenue of approximately $3.7 billion in 2022 .
- The number of full-time employees at Kantar in North America exhibited significant fluctuations from 2007 to 2022 .
- In 2022, Kantar employed approximately 4,700 full-time personnel in the North American region , marking the highest employment level within this timeframe.
- In 2022, Ipsos achieved a revenue of approximately 2.41 billion euros , marking a noteworthy increase of approximately 250 million euros compared to the previous year.
- Despite its origin in France in 1975 , Ipsos embarked on an extensive global expansion, particularly in the 1990s.
- It has consistently competed with significant global market research industry players regarding research revenue. It has become a prominent employer in the United States market research sector .
- Following the 2019 general election in Australia, Ipsos faced a setback. Several Australian newspapers ceased using them as their primary source for political polling due to their inaccurate prediction of the closely contested election. Nevertheless, Ipsos continues to provide valuable data and insights in other areas of polling and research.
- The number of Ipsos employees worldwide has fluctuated over the past decade. In 2012, there were 15,297 employees , and this figure steadily increased over the following years, reaching 17,059 in 2013 .
- However, by 2014, the number had dipped slightly to 16,530 . Subsequent years saw relatively stable employee numbers, with 16,450 in 2015 and 16,598 in 2016 .
- A slight upward trajectory resumed in 2017, with 16,664 employees that year, and a more substantial increase to 18,127 in 2018 .
- This growth continued into 2019 when there were 18,448 employees .
- However, in 2020, the numbers dropped to 16,472, likely influenced by external factors such as the global pandemic.
- The workforce rebounded in 2021, reaching 18,266 employees , and further expanded in 2022 , totaling 20,156 employees worldwide .

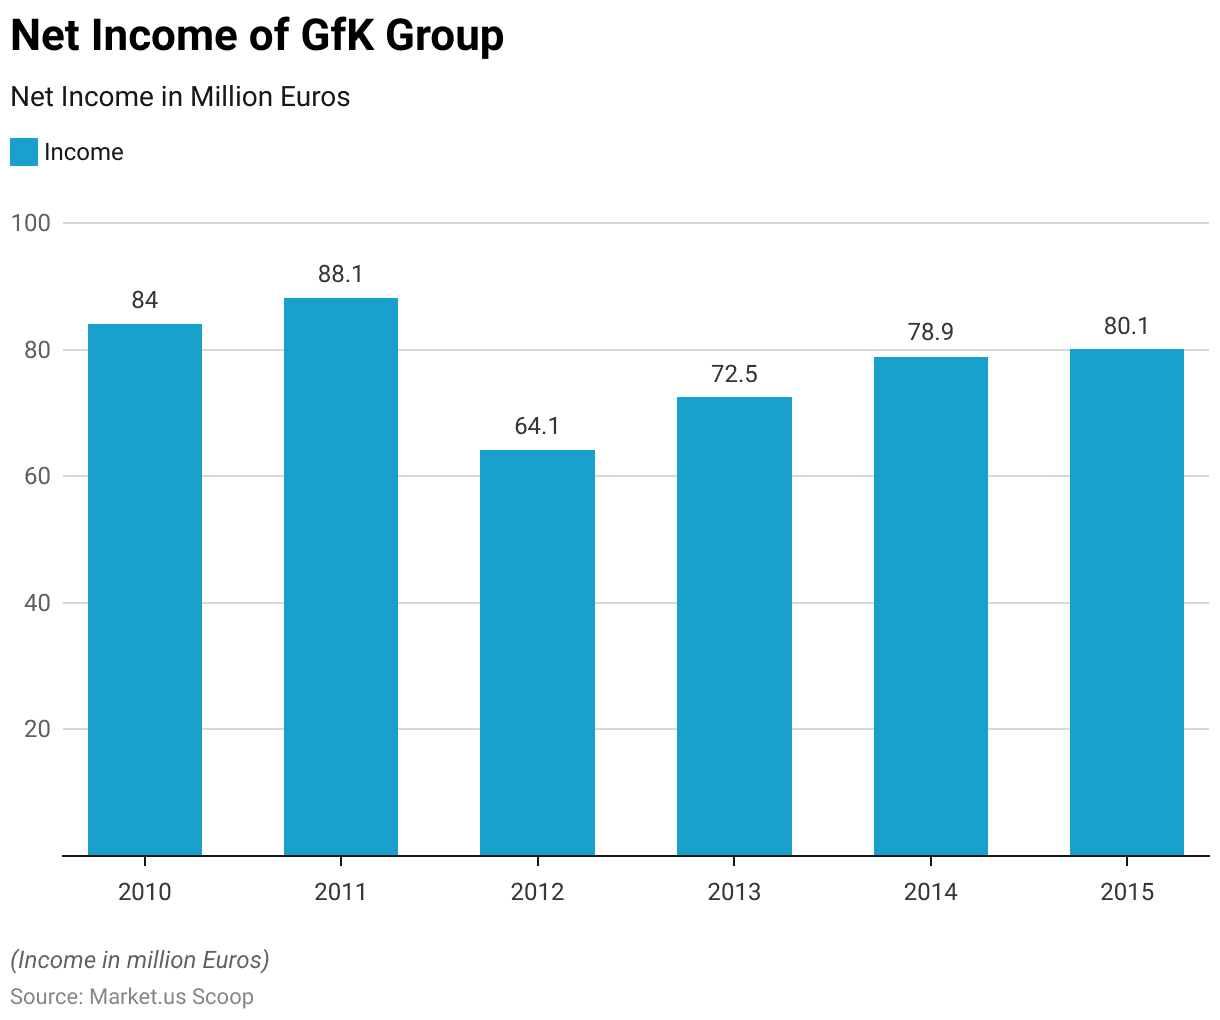
- The income of GfK Group, measured in million Euros, exhibits a pattern of fluctuations over six years from 2010 to 2015 .
- In 2010 the income stood at 84 million Euros , followed by a slight increase to 88.1 million Euros in 2011 .
- However, 2012 saw a noticeable dip in income to 64.1 million Euros .
- Subsequently, there was a gradual recovery, with an income of 72.5 million Euros in 2013 , followed by further growth to 78.9 million Euros in 2014 and 80.1 million Euros in 2015 .
- These fluctuations likely reflect shifts in market dynamics, economic conditions, and business strategies during this period, contributing to GfK Group’s income variations.
Gartner Inc.
- Gartner Inc., a leading IT advisory and benchmarking service player, is renowned for its 100+ “magic quadrants” enterprises use to assess and bolster their technology credibility.
- Their recent Q4 2021 earnings report exceeded Wall Street expectations, with a remarkable return on equity exceeding 100% .
- Since April 2021 , Gartner’s stock price has surged by a remarkable 181%, driven by the growing demand for digital expertise.
- Gartner operates in two key segments: Global Technology Sales (GTS), constituting 80% of their contract value at $3.4 billion in fiscal 2021, and Global Business Sales (GBS), contributing 20% at $874 million .
- Revenue composition leans heavily towards research (80%), with consulting (8%) and conferences (4%) making up the rest .
- Notably , 91% of Gartner’s revenue stems from subscription services , providing a robust recurring revenue model.
- Geographically, 64% of sales come from the U.S. and Canada , with a significant presence in the Europe, Middle East, and Africa regions accounting for 24% of sales .
(Source: Yahoo Finance)
- In 2015, Europe recorded revenues of $16.43 billion , while North America led with $19.45 billion .
- Asia-Pacific and Latin America generated $5.91 billion and $1.49 billion , respectively, while the Middle East and Africa contributed $0.76 billion . The United States accounted for a significant portion of North America’s revenue.
- By 2016, Europe’s revenue decreased slightly to $15.82 billion , while North America maintained its position at $19.83 billion .
- Asia-Pacific’s revenue rose to $6.44 billion, and Latin America reached $1.47 billion , with the Middle East & Africa at $0.86 billion .
- In 2017, North America’s revenue substantially increased to $41.02 billion , outpacing Europe’s $15.95 billion .
- Asia-Pacific, Latin America, the Middle East, and Africa also experienced revenue growth. This trend continued in 2018, with North America at $44.21 billion and Europe at $16.56 billion .
- By 2019 , North America’s revenue climbed to $47.76 billion , while Europe’s revenue decreased slightly to $15.83 billion .
- In 2020 , there was a notable surge in revenue across regions, with North America leading at $48.01 billion , followed by Europe, Asia-Pacific, and Latin America .
- The Middle East and Africa also saw an increase. In 2021, the growth continued, particularly in North America and Europe, which reported revenues of $62.64 billion and $29.71 billion , respectively. These figures reflect the dynamic shifts in revenue among these regions over the years.
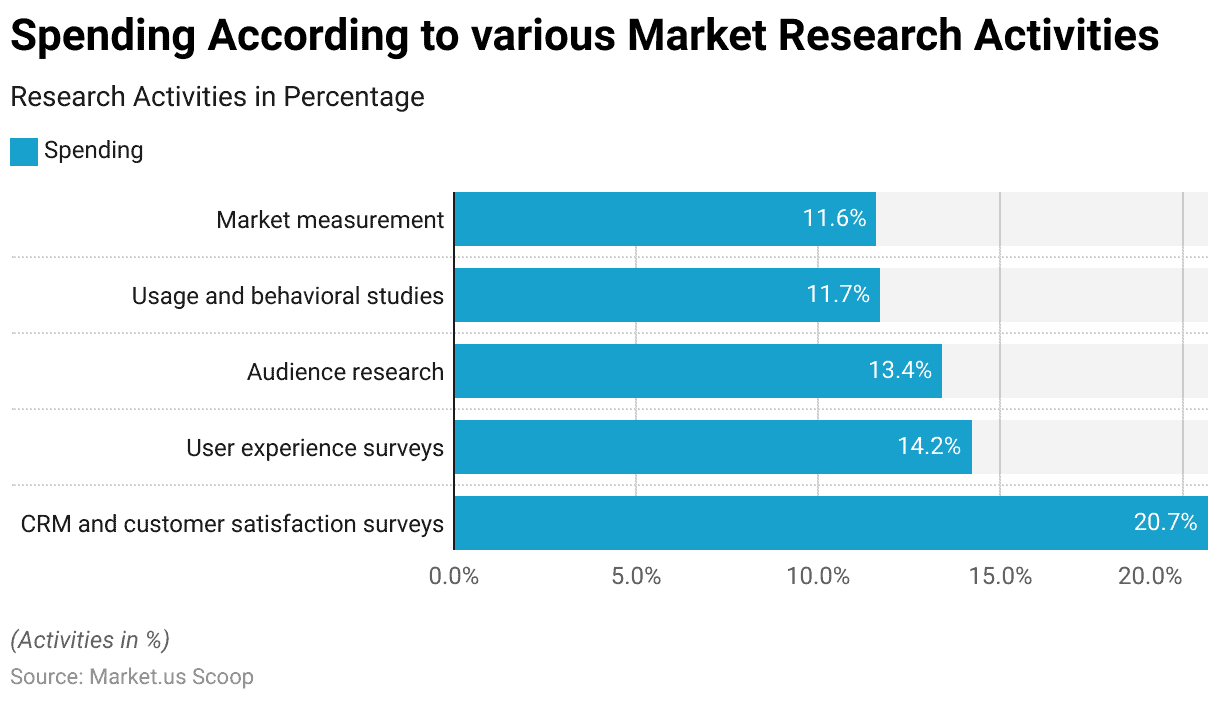
Spending According to Different Activities
- Organizations in this sector exhibit a varied focus in allocating their spending. Customer relationship management (CRM) and customer satisfaction surveys claim the largest share at 20.7%, underscoring the emphasis on maintaining and enhancing customer relationships.
- User experience surveys follow closely behind, with a significant allocation of 14.2% , highlighting the priority placed on optimizing user interactions.
- Audience research commands 13.4% of spending , reflecting a commitment to understanding and catering to specific target audiences.
- Meanwhile, investments in usage and behavioral studies stand at 11.7% , and market measurement closely trails at 11.6% , demonstrating the significance of data-driven insights for decision-making within this domain.
- These allocations underscore the multifaceted nature of research spending in this sector, emphasizing the importance of a balanced approach to gathering valuable insights.
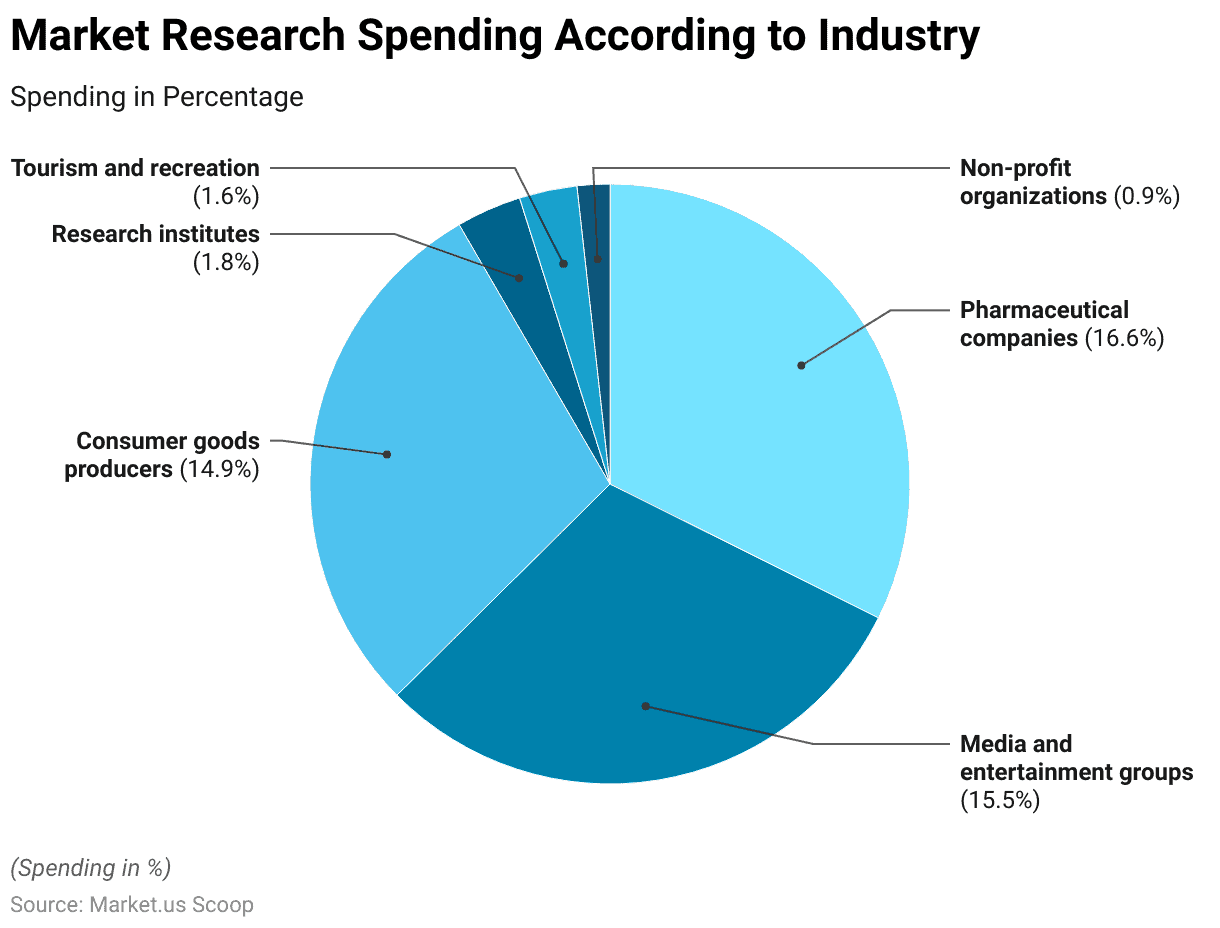
Spending According to Different Industries
- Market research spending across different industry sectors reveals diverse priorities. Pharmaceutical companies allocate a significant portion at 16.6% , reflecting their commitment to research and development.
- Media and entertainment groups follow closely at 15.5% , emphasizing the importance of understanding audience preferences and trends.
- Consumer goods producers allocate 14.9% , emphasizing consumer behavior and market dynamics.
- Research institutes, at 1.8%, and tourism and recreation, at 1.6%, have more modest allocations, indicating their research objectives may be narrower or more specialized.
- Non-profit organizations allocate the least, at 0.9%, which aligns with their typically constrained budgets. These varying percentages reflect how different sectors prioritize market research to inform decision-making and strategy within their respective domains.
– Quantitative Research
- In 2022, among traditional quantitative research methods , online surveys emerged as the dominant choice in the global market research industry.
- A substantial 85% of professionals reported using online surveys regularly, while 9% employed them occasionally .
- Mobile surveys followed, with 47% using them regularly and 33% occasionally.
- Proprietary panels and online communities were also frequently utilized, with 32% and 26% reporting regular use, respectively .
- In contrast, Computer-Assisted Telephone Interviewing (CATI) and face-to-face surveys were used less frequently, with 13% and 12% respectively employing them regularly.
- Other methods like Computer-Assisted Personal Interviewing (CAPI), automated measures/people meters, mail surveys, Interactive Voice Response (IVR), neuroscience measurements, and biometrics had lower regular usage rates . These findings underline the significant prevalence of online surveys as the preferred quantitative research method in the industry, reflecting the influence of digital advancements in the field.

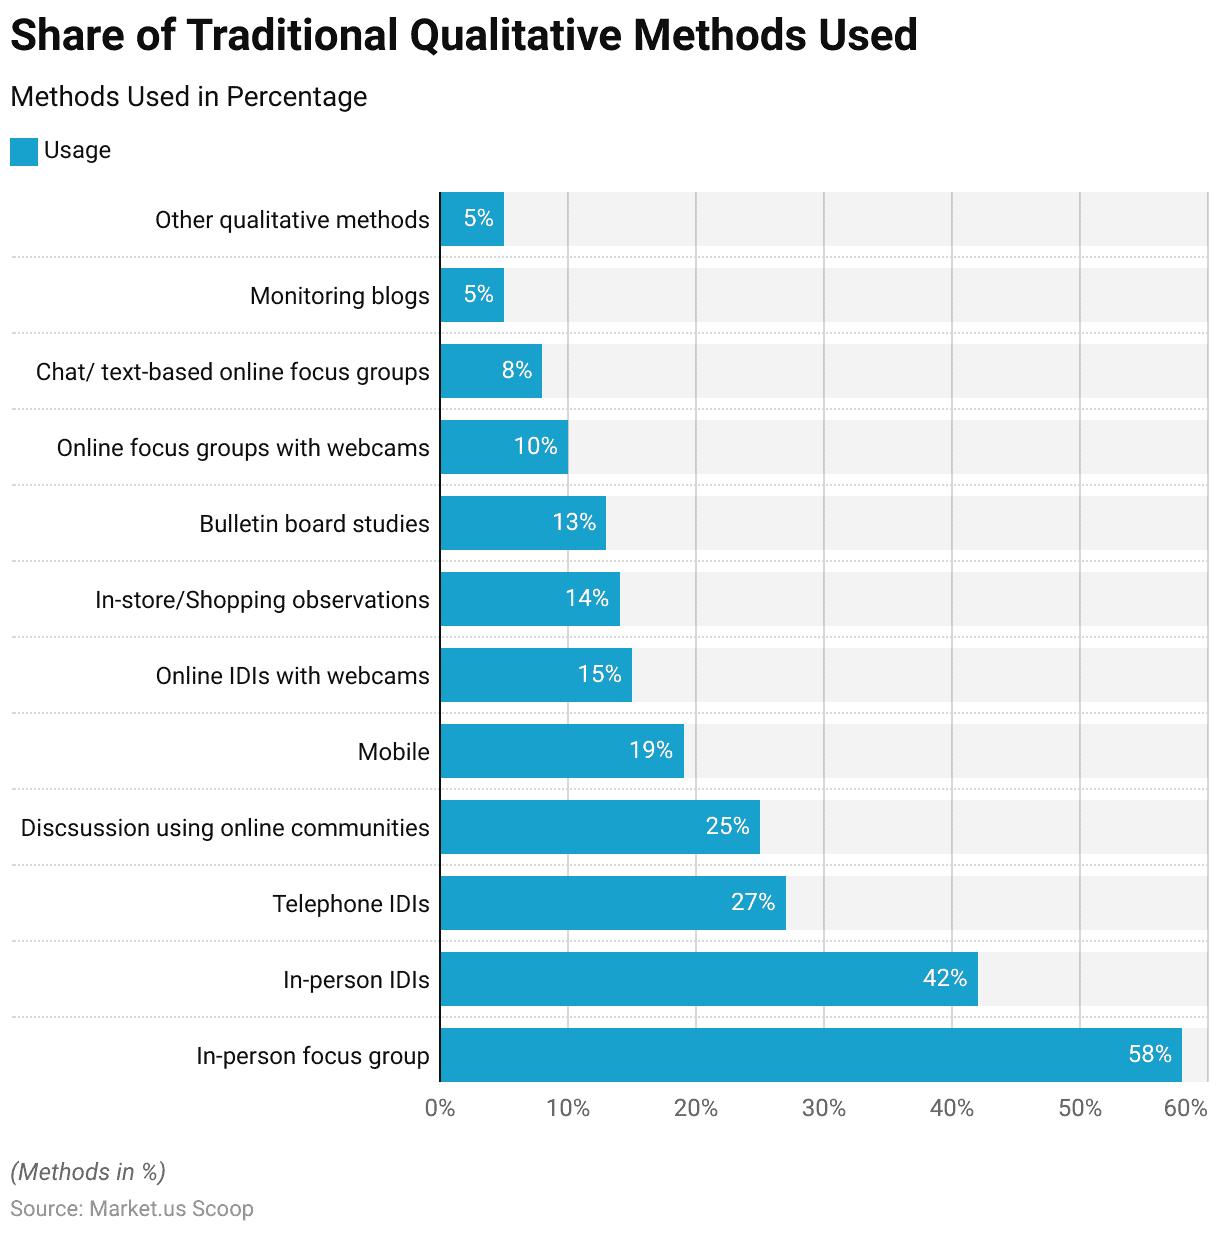
– Qualitative Research
- In 2022, online in-depth interviews conducted with webcams emerged as the most widely adopted approach within traditional qualitative research methodologies in the global market research industry. Approximately 15% of professionals reported using this method , reflecting its growing popularity in the digital age.
- In-person focus groups were a close second, with 58% employing this traditional method , highlighting its enduring relevance.
- In-person Individual Depth Interviews (IDIs) followed, with 42% of researchers utilizing this face-to-face approach.
- Telephone IDIs and online community discussions were also common, with 27% and 25% reporting their usage .
- Other methods, such as mobile research, in-store or shopping observations, and bulletin board studies, had varying levels of adoption.
- These findings underscore the diversified landscape of qualitative research techniques, with online in-depth interviews via webcams gaining prominence alongside well-established methods like in-person focus groups and IDIs .
- Here’s a comprehensive breakdown of various survey types and their average response rates. In-person surveys lead the pack with an impressive 57% response rate , underscoring the effectiveness of face-to-face interactions.
- Mail surveys follow closely, garnering a respectable 50% response rate , indicating the enduring relevance of traditional postal surveys.
- Email surveys exhibit a response rate of 30%, showcasing their popularity as a digital survey medium.
- Online surveys, conducted through web forms , capture a slightly lower but substantial response rate of 29% .
- While widely used, telephone surveys yield an 18% response rate , reflecting the challenges of phone-based data collection.
- In-app surveys, delivered through mobile applications, secure a 13% response rate , highlighting their unique place in the survey landscape. These response rates provide valuable insights for survey designers, helping them choose the most suitable method for effective data collection.
(Source: Pointerpro)
- The findings highlighted distinct preferences in skill development priorities in a survey encompassing 3,342 respondents, comprising both buyers and suppliers in the market research field.
- Notably, 70% of buyers strongly emphasized nurturing business knowledge as a vital skill.
- In contrast, 56% of suppliers echoed this sentiment .
- What stands out is that for suppliers , the paramount skill for development was identified as market research expertise, garnering a substantial 70% agreement .
- Conversely, among buyers , the significance of market research expertise in skill development was acknowledged by a comparatively lower proportion, precisely 34%.
(Source: GreenBook)
- Within organizations, a notable 23% lack a well-defined strategy for market research .
- The primary hurdle hindering market strategists is the prevailing uncertainty, which impedes the progress of 34% of them .
- Meanwhile, 26% of market researchers encounter obstacles due to budget limitations in executing their research strategies.
- Additional challenges include effectively communicating return on investment, inspiring team members, contending with internal priorities, and addressing gaps in skills and expertise .
(Source: Qualtrics)
Market Research Industry Statistics – The market research industry is at the forefront of transformative change, offering invaluable insights to businesses in an ever-evolving global landscape. It has exhibited significant growth, driven by technological advancements like AI and big data analytics. However, challenges such as data privacy and ethical considerations demand ongoing attention.
The industry’s future is promising, marked by even more profound insights and global expansion. To thrive, industry players must remain agile, embrace diversity in methodologies, and uphold ethical standards. As a trusted ally, market research will continue to empower businesses with the insights needed to make informed decisions and succeed in a dynamic marketplace, shaping the industry’s future.
Market research is the process of gathering, analyzing, and interpreting information about a market, including its size, trends, and consumer preferences. Businesses must make informed decisions, identify opportunities, and understand their target audience better.
Market research employs both quantitative and qualitative methods. Quantitative research includes surveys, experiments, and observational studies, while qualitative methods encompass focus groups, in-depth interviews, and ethnography.
Technology, including artificial intelligence, big data analytics, and mobile research tools, is revolutionizing market research by enabling faster data collection, deeper insights, and more efficient analysis.
Emerging trends include using AI for predictive analytics, increased focus on mobile and geo-location data, and a growing emphasis on sustainability and ethical research practices.
Market research helps businesses make informed decisions, refine their products and services, identify competitive advantages, and tailor their marketing strategies to meet customer needs effectively.

Tajammul Pangarkar
Tajammul Pangarkar is a CMO at Prudour Pvt Ltd. Tajammul longstanding experience in the fields of mobile technology and industry research is often reflected in his insightful body of work. His interest lies in understanding tech trends, dissecting mobile applications, and raising general awareness of technical know-how. He frequently contributes to numerous industry-specific magazines and forums. When he’s not ruminating about various happenings in the tech world, he can usually be found indulging in his next favorite interest - table tennis.
Latest from Author
- Cloud Telephony Service Market Soar to USD 52.3 Billion by 2033
- Top 10 Wearable Sensor Companies | Best Health Tech
- Telecom API Statistics 2024 By Tools, Technology, Networks
- Smart Home Statistics 2024 By Technology, Features, Security
- Smart TV Statistics 2024 By Technology, Quality, Content
- Technology, Media, and IT
- Media and Advertising
Digital Marketing Market
Global Digital Marketing Market to Grow at a CAGR of 13.1% Over the Forecast Period of 2024-2032

Global Digital Marketing Market Share, Size, Value, Growth: By Digital Channel: Email Marketing, Search Engine Optimisation (SEO), Interactive Consumer Website, Online/Display Advertising, Blogging and Podcasting, Social Network Marketing, Mobile Marketing, Others; By End User; Regional Analysis; Competitive Landscape; 2024-2032
- Report Summary
- Table of Contents
- Pricing Detail
- Request Sample
Global Digital Marketing Industry Outlook
The global digital marketing market size reached a value of nearly USD 363.05 billion in 2023. The market is projected to grow at a CAGR of 13.1% between 2024 and 2032, reaching a value of around USD 1099.33 billion by 2032.
Key Takeaways
- Short-term video content is the most popular content strategy and 91% of businesses use video marketing for advertising.
- Around 56% of businesses globally are planning on increasing their TikTok marketing budget, due to its surging popularity.
- The Asia Pacific is expected to be an emerging market for digital marketing, owing to increasing social media penetration.
Digital marketing is the digital promotion of products or services, primarily through the internet, but also include mobile phones, advertisement displays, and any other new digital medium. Some common aspects of digital marketing include search engine optimisation (SEO), search engine marketing (SEM), content marketing, content management, campaign marketing, display advertising, and social media advertising (SEM) that facilitate customer engagement with the brand’s offerings and solutions. In addition, digital marketing now also applies to non-internet platforms that provide digital media, such as mobile phones (SMS and MMS), call-backs, and on-site mobile ring tones.
Increased penetration of the internet across the globe is one of the major factors driving the digital marketing industry growth. This growth is further aided by the proliferation of smartphones and other smart devices that allow widespread internet access to users and provide ample digital marketing opportunities. The rising usage of social media is another crucial factor boosting the market expansion, as social media platforms offer businesses and enterprises a direct platform to engage and interact with their target audience. Therefore, several businesses have established social media pages on Instagram and Facebook for direct communication with their existing as well as potential customers.

Read more about this report - REQUEST FREE SAMPLE COPY IN PDF
Key Trends and Developments
Rising popularity of short-length video content; increasing focus of brands on enhancing business transparency to create a loyal customer base; emergence of social media as a prominent marketing tool; and the growing integration of AI and marketing tools are the major trends impacting the market.
Jan 3rd 2024
Accenture acquired Jixie, an intelligent media and marketing company, to offer a more personalised experience to its customers.
Jan 12th 2024
Picklejar announced the launch of FanVivo, a digital marketing solution, which can aid music artists and venues in enhancing their fan engagement.
Jan 17th 2024
LS Digital launched a transformative marketing data infrastructure (MDI), which allows businesses to leverage user insights to enhance the capabilities of its products and services.
Jan 18th 2024
UnFoldMart secured the social media and SEO mandate for Atmosly to enhance latter’s brand awareness and digital presence.
Rising trend of short video content
With the burgeoning popularity of TikTok and Instagram reels, businesses are focusing on video marketing content such as product demonstrations and customer testimonials for increased engagement.
Improved business transparency to create loyal customer base
In the age of transparency, businesses are increasingly demonstrating their vision, production processes, and practices, to establish a foundation of trust with their customers.
Use of social media to target potential customers
Social media platforms are increasingly being used as an effective marketing tool, for instance, LinkedIn is estimated to hold nearly 25 per cent of US B2B display ad spending by 2024.
Increased integration of AI in digital marketing
AI technology offers businesses sophisticated tools for personalised customer interactions so the companies can address specific customer needs and enhance customer satisfaction.
The digital marketing market demand is primarily supported by the growing adoption of digital tools by businesses to forge strong connections with customers, further highlighting their practices and sustainability initiatives to achieve brand loyalty. Several companies are taking initiatives to educate customers regarding the potential risks involved with their products and solutions to offer complete transparency. Businesses that put customer well-being over others are more likely to attract new customers as well as retain the old ones.
LD Digital, an India-based company, has launched a marketing data infrastructure (MDI), which comprises three main elements, collect, connect, and cultivate, to offer a seamless customer experience. It is a user-friendly platform that can integrate with marketing tools to offer businesses valuable insights on customer segmentation, sales forecasting, and brand sentiment analysis, so they can gain a better understanding of their customers.

Digital Marketing Market Segmentation
“Digital Marketing Market Report and Forecast 2024-2032” offers a detailed analysis of the market based on the following segments:
Market Breakup by Digital Channel
- Email Marketing
- Search Engine Optimisation (SEO)
- Interactive Consumer Website
- Online/Display Advertising
- Blogging and Podcasting (Including Microblogging)
- Social Network Marketing
- Mobile Marketing
- Viral Marketing
- Digital OOH Media
- Online Video Marketing
Market Breakup by End User
- Media and Entertainment
Market Segmentation by Region
- North America
- Asia Pacific
- Latin America
- Middle East and Africa
Online/display advertising is a leading strategy adopted by businesses owing to its eye-catching attributes
According to our analysis of the digital marketing market size, the online/display advertising segment occupies a significant market share as display ads are visually appealing and capture the attention of the audience easily. Display ads are targeted, and businesses can choose the geographic area or demographic age for which the display ads should be visible, which further makes them an effective form of digital marketing.
The expenditure on mobile advertisements, which once accounted for nearly 13 to 18% of total digital spending in 2016, currently accounts for about 39–42% of the digital spending in the major Western European markets, such as the United Kingdom, Germany and Spain, and is expected to cross 60% in the next few years.
Mobile marketing is expected to continue to grow in the coming years as businesses focus on leveraging the extensive reach of smartphones to enhance their visibility and engagement. With increasing emphasis on mobile-friendly campaigns and websites, they are increasing their investments to provide a seamless user experience.
The media and entertainment sector holds a leading position due to the heavy reliance of streaming platforms on digital mediums for promotions.
The media and entertainment sector heavily relies on digital marketing campaigns to drive user engagement and reach a broader audience. For example, Netflix, a streaming service, heavily relies on different mediums of digital marketing to promote their shows and movies depending on the user’s preferences and region.
The education sector is also expected to flourish in the forecast period as several educational institutions are leveraging social media platforms to showcase their campus life, amenities, and standout features to gain a competitive edge.

Competitive Landscape
The market players are increasing their collaboration and research and development activities to gain a competitive edge in the market
Dentsu Group Inc.
Dentsu Group, founded in 1901 and based in Tokyo, Japan, is an international advertising corporation. Some of its specialities include advertising, media planning, and media buying, among others.
Saudi Research and Media Group (SRMG)
SRMG, a media group in the MENA, announced in 2024, that it is developing digital platforms for some of its newspapers, amid the rising popularity of digital and audio-visual media platforms.
Havas Group
It is a global advertising and public relations company, based in Paris, France. The company offers innovative solutions through its three business units, including Havas Creative Network and Havas Media Network.
WebFX, founded in 2008, is a digital marketing solutions provider, based in Pennsylvania, the US. The company comprises over 400 experts who aid SMEs and large enterprises with digital marketing services.
Several market players are working strategically to develop platforms that can help businesses navigate through a complex marketing landscape by optimising customer data effectively. By leveraging insights offered by such platforms, manufacturers and brand owners can work together to create efficient digital marketing industry solutions to target customers, as these marketing solutions are expected to be reliable and result-driven, ensuring consistent business growth.
North America is a leading regional market and is expected to continue to maintain its dominance in the coming years. The region is expected to contribute about 38% to 42% to the total digital marketing expenditure in the forecast period. The region is a technological hub and offers ample opportunities for innovation in the digital marketing sphere. The growing adoption of high-end technologies by market players to enhance their capabilities and offer improved marketing solutions creates a positive market outlook.
The digital advertising investment in the Asia Pacific has surpassed Europe, and this increase is driven mainly by regions like China and other emerging Asian markets, due to a growing investment in technology and increasing use of digital platforms in these countries. The Asia Pacific region is expected to be the major contributor to the digital marketing market share over the coming years due to the region’s high population density, the growing internet penetration, and the increased smartphone ownership. The Asia Pacific has the largest population of smartphone users in comparison to other regions. Also, a large proportion of mobile phone users in the region have access to social media, creating significant growth prospects for the online advertising segment.
The increasing adoption of real-time bidding (RTB) of online display advertisement slots, as well as the increasing consumption of video advertisements and rich media, is expected to enhance the display advertising expenditure in Western Europe. The digital out-of-home (OOH) media is expected to be largely limited to developed countries, for example, the installation of digital televisions in gas stations, among other places.
Key Highlights of the Report
Our best selling reports.
Outdoor Flooring Market
Guatemala Cheese Market
Medical Education Market
Permanent Magnets Market
Silicon Photonics Market
TFT-LCD Display Panel Market
Vacuum Truck Market
Chromium Market
Forklift Market
Lighting Market
*At Expert Market Research, we strive to always give you current and accurate information. The numbers depicted in the description are indicative and may differ from the actual numbers in the final EMR report.
1 Preface 2 Report Coverage – Key Segmentation and Scope 3 Report Description 3.1 Market Definition and Outlook 3.2 Properties and Applications 3.3 Market Analysis 3.4 Key Players 4 Key Assumptions 5 Executive Summary 5.1 Overview 5.2 Key Drivers 5.3 Key Developments 5.4 Competitive Structure 5.5 Key Industrial Trends 6 Market Snapshot 6.1 Global 6.2 Region 7 Opportunities and Challenges in the Market 8 Global Digital Marketing Market Analysis 8.1 Key Industry Highlights 8.2 Global Digital Marketing Historical Market (2018-2023) 8.3 Global Digital Marketing Market Forecast (2024-2032) 8.4 Global Digital Marketing Market by Digital Channel 8.4.1 Email Marketing 8.4.1.1 Historical Trend (2018-2023) 8.4.1.2 Forecast Trend (2024-2032) 8.4.2 Search Engine Optimisation (SEO) 8.4.2.1 Historical Trend (2018-2023) 8.4.2.2 Forecast Trend (2024-2032) 8.4.3 Interactive Consumer Website 8.4.3.1 Historical Trend (2018-2023) 8.4.3.2 Forecast Trend (2024-2032) 8.4.4 Online/Display Advertising 8.4.4.1 Historical Trend (2018-2023) 8.4.4.2 Forecast Trend (2024-2032) 8.4.5 Blogging and Podcasting (Including Microblogging) 8.4.5.1 Historical Trend (2018-2023) 8.4.5.2 Forecast Trend (2024-2032) 8.4.6 Social Network Marketing 8.4.6.1 Historical Trend (2018-2023) 8.4.6.2 Forecast Trend (2024-2032) 8.4.7 Mobile Marketing 8.4.7.1 Historical Trend (2018-2023) 8.4.7.2 Forecast Trend (2024-2032) 8.4.8 Viral Marketing 8.4.8.1 Historical Trend (2018-2023) 8.4.8.2 Forecast Trend (2024-2032) 8.4.9 Digital OOH Media 8.4.9.1 Historical Trend (2018-2023) 8.4.9.2 Forecast Trend (2024-2032) 8.4.10 Online Video Marketing 8.4.10.1 Historical Trend (2018-2023) 8.4.10.2 Forecast Trend (2024-2032) 8.4.11 Others 8.5 Global Digital Marketing Market by End Use 8.5.1 Automotive 8.5.1.1 Historical Trend (2018-2023) 8.5.1.2 Forecast Trend (2024-2032) 8.5.2 BFSI 8.5.2.1 Historical Trend (2018-2023) 8.5.2.2 Forecast Trend (2024-2032) 8.5.3 Education 8.5.3.1 Historical Trend (2018-2023) 8.5.3.2 Forecast Trend (2024-2032) 8.5.4 Government 8.5.4.1 Historical Trend (2018-2023) 8.5.4.2 Forecast Trend (2024-2032) 8.5.5 Healthcare 8.5.5.1 Historical Trend (2018-2023) 8.5.5.2 Forecast Trend (2024-2032) 8.5.6 Media and Entertainment 8.5.6.1 Historical Trend (2018-2023) 8.5.6.2 Forecast Trend (2024-2032) 8.5.7 Others 8.6 Global Digital Marketing Market by Region 8.6.1 North America 8.6.1.1 Historical Trend (2018-2023) 8.6.1.2 Forecast Trend (2024-2032) 8.6.2 Europe 8.6.2.1 Historical Trend (2018-2023) 8.6.2.2 Forecast Trend (2024-2032) 8.6.3 Asia Pacific 8.6.3.1 Historical Trend (2018-2023) 8.6.3.2 Forecast Trend (2024-2032) 8.6.4 Latin America 8.6.4.1 Historical Trend (2018-2023) 8.6.4.2 Forecast Trend (2024-2032) 8.6.5 Middle East and Africa 8.6.5.1 Historical Trend (2018-2023) 8.6.5.2 Forecast Trend (2024-2032) 9 North America Digital Marketing Market Analysis 9.1 Market by Digital Channel 9.2 Market by End Use 9.3 Market by Country 9.3.1 United States of America 9.3.1.1 Historical Trend (2018-2023) 9.3.1.2 Forecast Trend (2024-2032) 9.3.2 Canada 9.3.2.1 Historical Trend (2018-2023) 9.3.2.2 Forecast Trend (2024-2032) 10 Europe Digital Marketing Market Analysis 10.1 Market by Digital Channel 10.2 Market by End Use 10.3 Market by Country 10.3.1 United Kingdom 10.3.1.1 Historical Trend (2018-2023) 10.3.1.2 Forecast Trend (2024-2032) 10.3.2 Germany 10.3.2.1 Historical Trend (2018-2023) 10.3.2.2 Forecast Trend (2024-2032) 10.3.3 France 10.3.3.1 Historical Trend (2018-2023) 10.3.3.2 Forecast Trend (2024-2032) 10.3.4 Italy 10.3.4.1 Historical Trend (2018-2023) 10.3.4.2 Forecast Trend (2024-2032) 10.3.5 Others 11 Asia Pacific Digital Marketing Market Analysis 11.1 Market by Digital Channel 11.2 Market by End Use 11.3 Market by Country 11.3.1 China 11.3.1.1 Historical Trend (2018-2023) 11.3.1.2 Forecast Trend (2024-2032) 11.3.2 Japan 11.3.2.1 Historical Trend (2018-2023) 11.3.2.2 Forecast Trend (2024-2032) 11.3.3 India 11.3.3.1 Historical Trend (2018-2023) 11.3.3.2 Forecast Trend (2024-2032) 11.3.4 ASEAN 11.3.4.1 Historical Trend (2018-2023) 11.3.4.2 Forecast Trend (2024-2032) 11.3.5 Australia 11.3.5.1 Historical Trend (2018-2023) 11.3.5.2 Forecast Trend (2024-2032) 11.3.6 Others 12 Latin America Digital Marketing Market Analysis 12.1 Market by Digital Channel 12.2 Market by End Use 12.3 Market by Country 12.3.1 Brazil 12.3.1.1 Historical Trend (2018-2023) 12.3.1.2 Forecast Trend (2024-2032) 12.3.2 Argentina 12.3.2.1 Historical Trend (2018-2023) 12.3.2.2 Forecast Trend (2024-2032) 12.3.3 Mexico 12.3.3.1 Historical Trend (2018-2023) 12.3.3.2 Forecast Trend (2024-2032) 12.3.4 Others 13 Middle East and Africa Digital Marketing Market Analysis 13.1 Market by Digital Channel 13.2 Market by End Use 13.3 Market by Country 13.3.1 Saudi Arabia 13.3.1.1 Historical Trend (2018-2023) 13.3.1.2 Forecast Trend (2024-2032) 13.3.2 United Arab Emirates 13.3.2.1 Historical Trend (2018-2023) 13.3.2.2 Forecast Trend (2024-2032) 13.3.3 Nigeria 13.3.3.1 Historical Trend (2018-2023) 13.3.3.2 Forecast Trend (2024-2032) 13.3.4 South Africa 13.3.4.1 Historical Trend (2018-2023) 13.3.4.2 Forecast Trend (2024-2032) 13.3.5 Others 14 Market Dynamics 14.1 SWOT Analysis 14.1.1 Strengths 14.1.2 Weaknesses 14.1.3 Opportunities 14.1.4 Threats 14.2 Porter’s Five Forces Analysis 14.2.1 Supplier’s Power 14.2.2 Buyer’s Power 14.2.3 Threat of New Entrants 14.2.4 Degree of Rivalry 14.2.5 Threat of Substitutes 14.3 Key Indicators for Demand 14.4 Key Indicators for Price 15 Competitive Landscape 15.1 Market Structure 15.2 Company Profiles 15.2.1 Accenture Plc 15.2.1.1 Company Overview 15.2.1.2 Product Portfolio 15.2.1.3 Demographic Reach and Achievements 15.2.1.4 Certifications 15.2.2 IBM Corporation 15.2.2.1 Company Overview 15.2.2.2 Product Portfolio 15.2.2.3 Demographic Reach and Achievements 15.2.2.4 Certifications 15.2.3 Dentsu Group Inc. 15.2.3.1 Company Overview 15.2.3.2 Product Portfolio 15.2.3.3 Demographic Reach and Achievements 15.2.3.4 Certifications 15.2.4 Havas Group 15.2.4.1 Company Overview 15.2.4.2 Product Portfolio 15.2.4.3 Demographic Reach and Achievements 15.2.4.4 Certifications 15.2.5 WebFX 15.2.5.1 Company Overview 15.2.5.2 Product Portfolio 15.2.5.3 Demographic Reach and Achievements 15.2.5.4 Certifications 15.2.6 RAPP Worldwide Inc. 15.2.6.1 Company Overview 15.2.6.2 Product Portfolio 15.2.6.3 Demographic Reach and Achievements 15.2.6.4 Certifications 15.2.7 Disruptive Advertising 15.2.7.1 Company Overview 15.2.7.2 Product Portfolio 15.2.7.3 Demographic Reach and Achievements 15.2.7.4 Certifications 15.2.8 Thrive Internet Marketing Agency 15.2.8.1 Company Overview 15.2.8.2 Product Portfolio 15.2.8.3 Demographic Reach and Achievements 15.2.8.4 Certifications 15.2.9 TopSpot Internet Marketing 15.2.9.1 Company Overview 15.2.9.2 Product Portfolio 15.2.9.3 Demographic Reach and Achievements 15.2.9.4 Certifications 15.2.10 PB&J Promotions LLC 15.2.10.1 Company Overview 15.2.10.2 Product Portfolio 15.2.10.3 Demographic Reach and Achievements 15.2.10.4 Certifications 15.2.11 Others 16 Key Trends and Developments in the Market
List of Key Figures and Tables
1. Global Digital Marketing Market: Key Industry Highlights, 2018 and 2032 2. Global Digital Marketing Historical Market: Breakup by Digital Channel (USD Million), 2018-2023 3. Global Digital Marketing Market Forecast: Breakup by Digital Channel (USD Million), 2024-2032 4. Global Digital Marketing Historical Market: Breakup by End User (USD Million), 2018-2023 5. Global Digital Marketing Market Forecast: Breakup by End User (USD Million), 2024-2032 6. Global Digital Marketing Historical Market: Breakup by Region (USD Million), 2018-2023 7. Global Digital Marketing Market Forecast: Breakup by Region (USD Million), 2024-2032 8. North America Digital Marketing Historical Market: Breakup by Country (USD Million), 2018-2023 9. North America Digital Marketing Market Forecast: Breakup by Country (USD Million), 2024-2032 10. Europe Digital Marketing Historical Market: Breakup by Country (USD Million), 2018-2023 11. Europe Digital Marketing Market Forecast: Breakup by Country (USD Million), 2024-2032 12. Asia Pacific Digital Marketing Historical Market: Breakup by Country (USD Million), 2018-2023 13. Asia Pacific Digital Marketing Market Forecast: Breakup by Country (USD Million), 2024-2032 14. Latin America Digital Marketing Historical Market: Breakup by Country (USD Million), 2018-2023 15. Latin America Digital Marketing Market Forecast: Breakup by Country (USD Million), 2024-2032 16. Middle East and Africa Digital Marketing Historical Market: Breakup by Country (USD Million), 2018-2023 17. Middle East and Africa Digital Marketing Market Forecast: Breakup by Country (USD Million), 2024-2032 18. Global Digital Marketing Market Structure.
What was the global digital marketing market value in 2023?
In 2023, the market reached an approximate value of USD 363.05 billion.
What is the growth rate of the global digital marketing market?
The market is estimated to grow at a CAGR of 13.1% between 2024 and 2032.
What is the global digital marketing market forecast for 2024-2032?
The market is estimated to witness a healthy growth during 2024-2032 to reach around USD 1099.33 billion by 2032.
What are the major industry drivers?
The major drivers of the market include the rising number of online video and mobile advertising, increasing adoption of real-time bidding (RTB) of online display advertisement slots, increasing consumption of video advertisements and rich media, rising number of end users, growing internet penetration, and the rising smartphone ownership.
What are the key digital marketing market trends?
The key trends aiding the market include the rising trend of short video content, the growing focus on ethical marketing by brands, the emergence of LinkedIn as a prominent B2B advertiser, and the increased integration of AI in digital marketing.
What are the major regional markets of digital marketing, according to the EMR report?
The major regions in the industry are North America, Latin America, the Middle East and Africa, Europe, and the Asia Pacific.
What are the significant end uses of digital marketing?
The significant end uses include BFSI, pharmaceuticals, and retail, among others.
Who are the key market players, according to the global digital marketing market report?
The major players in the market are Accenture Plc, IBM Corporation, Dentsu Group Inc., Havas Group, WebFX, RAPP Worldwide Inc., Disruptive Advertising, Thrive Internet Marketing Agency, TopSpot Internet Marketing, and PB&J Promotions LLC, among others.
Purchase Options 10% off
Methodology

Request Customisation
Report Sample

Request Brochure
Ask an Analyst
( USA & Canada ) +1-415-325-5166 [email protected]
( United Kingdom ) +44-702-402-5790 [email protected]
Mini Report
- Selected Sections, One User
- Printing Not Allowed
- Email Delivery in PDF
- Free Limited Customisation
- Post Sales Analyst Support
- 50% Discount on Next Update
Single User License
- All Sections, One User
- One Print Allowed

Five User License
- All Sections, Five Users
- Five Prints Allowed
Corporate License
- All Sections, Unlimited Users
- Unlimited Prints Allowed
- Email Delivery in PDF + Excel
Any Question? Speak With An Analyst
View A Sample
Did You Miss Anything, Ask Now
Right People
We are technically excellent, strategic, practical, experienced and efficient; our analysts are hand-picked based on having the right attributes to work successfully and execute projects based on your expectations.
Right Methodology
We leverage our cutting-edge technology, our access to trusted databases, and our knowledge of the current models used in the market to deliver you research solutions that are tailored to your needs and put you ahead of the curve.
Right Price
We deliver in-depth and superior quality research in prices that are reasonable, unmatchable, and shows our understanding of your resource structure. We, additionally, offer attractive discounts on our upcoming reports.
Right Support
Our team of expert analysts are at your beck and call to deliver you optimum results that are customised to meet your precise needs within the specified timeframe and help you form a better understanding of the industry.
Stay informed with our free industry updates.
We use cookies, just to track visits to our website, we store no personal details. Privacy Policy X
Press Release
Industry Statistics
- Report Store
- AMR in News
- Press Releases
- Request for Consulting
- Our Clients

Events Industry Market Size, Share, Competitive Landscape and Trend Analysis Report by Type, by Revenue Source, by Organizer, by Age Group : Global Opportunity Analysis and Industry Forecast, 2023-2032
CG : Hospitality
Report Code: A02091
Tables: 240
Get Sample to Email
Thank You For Your Response !
Our Executive will get back to you soon
Events Industry Market Research, 2032
The global events industry market was valued at $1.1 trillion in 2019, and is projected to reach $2.1 trillion by 2032, growing at a CAGR of 6.4% from 2023 to 2032.
Events refer to public gathering of populace at a determined time and place for a purpose. The purpose for staging an event can be to increase business profitability, celebratory, entertainment, and community causes. The most popular events include conference & exhibition, corporate events & seminar, promotion & fundraising, music & art performances, sports, festival, trade shows, and product launch. The key stakeholders within the events industry are corporate organizations, public organizations & NGOs, and similar others.

MARKET DYNAMICS
The primary factor behind the expansion of the events industry market is the surge in event sponsorships on a global scale. Leading players across diverse industries are heavily investing in events, such as sporting competitions and concerts, as a strategic means to promote and raise awareness about the products and services offered by their respective businesses. By sponsoring these events, companies aim to capitalize on the extensive reach and audience engagement that such gatherings command, thereby fostering brand visibility, customer engagement, and potential business growth opportunities. This trend of heightened sponsorships underscores the pivotal role events play in the modern business landscape, making it a key driver of market growth and competitiveness. Event sponsorship is a crucial strategic investment for businesses seeking enhanced brand visibility and targeted marketing opportunities. Sponsorship is used to provide financial assistance to an event or organization. In addition, sponsorship allows the main players to advertise their products and reach a diverse consumer base, which ultimately increases product acceptance. Tax deductions on sponsorship expenses present added incentives for businesses to capitalize on these opportunities, maximizing returns on their marketing investments. This event sponsorship offers a comprehensive array of benefits that facilitate the achievement of marketing, branding, and financial objectives of the business. Moreover, it also promotes brand loyalty and helps to concentrate on consumer preferences, which helps with the growth of events market industry. Furthermore, events serve as effective means to captivate the interest of existing and prospective customers, which thus leaves a positive impression that fosters heightened brand loyalty.
However, the process of event organization entails intricacies and significant expenditures that consists of various cost factors that collectively contribute to the overall operational outlay. These expenses include on-site fees, venue costs, food and catering expenditures, event rentals, entertainment expenses, and production costs. On-site expenses entail charges imposed by the event venue, which can significantly add to the overall budget of the event. In addition, venue costs comprise various components such as security deposits, room rentals, insurance coverage, and parking fees. The food and catering aspect involves the cost of providing beverages, meals, and labor fees for servers, among other related expenses. Another substantial cost in event organization is the production expenditure, which covers the logistics of planning and managing administrative elements, along with efforts to attract attendees. These costs collectively contribute to the high operational expenses incurred in the process of organizing events. Therefore, the substantial financial burden associated with event planning becomes a prominent factor that hampers the growth of the global event market.
The evolution of event management was significantly influenced by technological advancements, transforming the way communication and transactions take place in real time. Online booking, phone calls, emails, and video conferences have revolutionized event planning, making it cost-effective and easily accessible. This shift in approach enabled event organizers to reach a broader customer base through various creative means facilitated by digital evolution. The proliferation of smartphones, desktop apps, and mobile apps played a pivotal role in streamlining event organization, which thus makes it more efficient and manageable. These technological tools empowered individuals to organize, coordinate, and execute tasks with ease and minimal time and effort investment. As a result, events are conducted seamlessly through webinars and video conferences, which opens lucrative opportunities for market expansion in the foreseeable future. With the help of technology, event managers can now efficiently handle event logistics, registration, and ticketing processes, leading to enhanced attendee experiences and increased satisfaction. Moreover, real-time communication tools facilitate better coordination among event teams, which ensures smoother execution and reduced chances of errors. In addition to optimizing internal processes, technology paved the way for enhanced customer engagement and personalization. Event organizers may leverage data analytics to understand preferences and behaviors of attendees and may tailor the event experiences to suit individual needs. This not only boosts customer satisfaction but also strengthens brand loyalty and increases the likelihood of repeated attendance. Furthermore, the trend of online events through webinars and video conferences is expected to grow continuously. This presents new opportunities for businesses to expand their market reach beyond geographical boundaries, tapping into global audiences and fostering international collaborations, which may bring significant changes in Events Industry statistics.
SEGMENTAL OVERVIEW
The events industry is segmented into type, revenue source, organizer, age group, and region. Based on type, the market is divided into music concerts, festivals, sports, exhibitions & conferences, corporate events & seminars, and others. On the basis of revenue source, it is segregated into ticket sale, sponsorship, and others. As per organizer, it is categorized into corporate, sports, education, entertainment, and others. By age group, it is fragmented into below 20 years, 21–40 years, and above 40 years. Region wise, the market is analyzed across North America, Europe, Asia-Pacific, and LAMEA.

The corporate events and seminars segment, as per type, dominated the global events industry market in 2022 and is anticipated to maintain its dominance throughout the forecast period. Corporate events and seminars are organized to create a learning-by-doing atmosphere through experiments, discussions, and interactions among participants. They comprise various types of gatherings, such as conventions, symposia, congresses, incentive group events, marketing events, special celebrations, seminars, courses, public or trade shows, product launches, exhibitions, company general meetings, corporate retreats, study tours, or training programs. Corporate events & seminars play a crucial role in fostering and reinforcing relationships with current and potential clients and agencies, while also serving as a means of inspiring and motivating employees, stakeholders, and business associates through effective messages. This segment has helped to increase the Events Industry Size, along with Events Industry Share, thus which has brought events industry trends leading to events industry growth.
BY REVENUE SOURCE

As per revenue source, the sponsorship segment dominated the global events industry market in 2022 and is anticipated to maintain its dominance throughout the forecast period. Sponsorship plays a crucial role in effective marketing due to its ability to enhance event programs and offset increasing expenses. It serves as a potent complement to other marketing initiatives, as it effectively delivers messages to the target audience and helps to build brand awareness. Thus, by sponsoring events, businesses can expand their reach to potential buyers and customers, ultimately driving sales. These factors are expected to contribute to the growth of the events industry in the foreseeable future.
BY ORGANIZER

As per organizer, the entertainment segment dominated the global events industry market in 2022 and is anticipated to maintain its dominance throughout the forecast period. The entertainment industry comprises club festivals that feature music conferences and international music professionals. These conferences bring together performing artists and speakers from around the globe to network and share ideas. The lineup of speakers includes entrepreneurs, artists, producers, and industry leaders. These events primarily aim to innovate, educate, and inspire professionals in the electronic music field and foster discussions on new technologies and social & environmental responsibility. Event management companies prioritize aspects such as social media presence, on-site food offerings, live music experiences, virtual reality encounters, and other amenities.Therefore, this segment has helped to increase the Events Industry Size, along with Events Industry Share, thus which has brought events industry trends leading to events industry growth.
BY AGE GROUP

As per age group, the 21-40 years segment dominated the global events industry market in 2022 and is anticipated to maintain its dominance throughout the forecast period. The significant growth of this market, especially among individuals aged between 21 and 40 years, can be attributed to their enthusiastic engagement in diverse events, including exhibitions, conferences, seminars, and music concerts. This age group actively participates in various gatherings and shows, contributing to the overall market expansion. In addition, there is a rising interest in entrepreneur and business-focused seminars and conferences, where young individuals who seek to establish their own ventures can gain valuable guidance and insights. Aspiring entrepreneurs find these events beneficial in gaining essential knowledge and direction, which further fuels the market expansion within this age segment. The rising popularity of music concerts and festive gatherings is also expected to positively impact the overall events industry market growth.

Region-wise, Europe is predicted to dominate the market with the largest share during the forecast period (2023-2032). Germany and Spain are expected to experience the highest increase in activity, with various types of meetings witnessing growth in both numbers and attendees. Companies in the region have become more prudent with their spending, which thus leads to a demand for events within closer proximity and at mid-scale venues such as conferences, seminars, and festivals. Europe has been successful in attracting international association conferences, with over half of the top destinations for such conferences located in the region. The events industry in Europe experiences further growth due to the increase in adoption of smart devices and internet usage, which resulted in a gradual rise in online bookings for music concerts, sports events, and other gatherings. Moreover, owing to the substantial impact on the GDP of western European countries such as the UK, Germany, the Netherlands, Belgium, and Czechia, European governments actively support and promote the events sector. Europe has high Events Industry Demand owing to increasing number of events in the region which is promoting Events Industry Opportunities
The events industry in Asia-Pacific is experiencing rapid growth driven by strong economic expansion, regional cooperation, and intellectual advancement, which may create Events Industry Opportunities during the Events Industry Forecast period. Countries in the region have witnessed an increase in sports leagues, digital activation, and adoption of innovative technology. The growing interest of youth, particularly in India and China, in attending conferences, exhibitions, concerts, shows, and other events is contributing to market growth. The robust economic growth in the region provides attractive business opportunities for investors, while high internet and technology penetration in densely populated countries enhances awareness about upcoming events. Social media has emerged as a crucial tool to reach a wide audience and understand preferences to conduct successful events. Thus, Asia-Pacific region is expected to boost in terms of market growth in coming years.
COMPETITION ANALYSIS
The major players analyzed for the events industry market are Access Destination Services, BCD GROUP (BCD MEETINGS & EVENTS), ATPI Ltd., Riviera Events, Entertaining Asia, Live Nation Worldwide Inc., StubHub, Anschutz Entertainment Group, Pollstar, Cvent Inc., Capita Plc., Reed Exhibitions, Questex LLC, Outback Concerts, The Freeman Company, Penguins Limited, CL Events, Seven Events Ltd., Clarion Events Ltd., and Versatile Event Management.
Manufacturers in the events industry market are actively engaged in meeting dynamically changing customer demands by continuous production of new and innovative services with enhanced features. During the Events Industry Analysis it was observed that market players invest in research and development to drive innovation, improve functionality, and provide greater choice to their customers. As a result of which they collaborate with production partners, regulatory bodies, and industry stakeholders to navigate different services, regulatory compliance, and stay ahead of industry trends. Manufacturers are focused on expansion of their services while optimizing costs, which may help them to cater to the increase in demand from the customer.
Key Benefits For Stakeholders
- This report provides a quantitative analysis of the market segments, current trends, estimations, and dynamics of the events industry market analysis from 2019 to 2032 to identify the prevailing events industry market opportunities.
- The market research is offered along with information related to key drivers, restraints, and opportunities.
- Porter's five forces analysis highlights the potency of buyers and suppliers to enable stakeholders make profit-oriented business decisions and strengthen their supplier-buyer network.
- In-depth analysis of the events industry market segmentation assists to determine the prevailing market opportunities.
- Major countries in each region are mapped according to their revenue contribution to the global market.
- Market player positioning facilitates benchmarking and provides a clear understanding of the present position of the market players.
- The report includes the analysis of the regional as well as global events industry market trends, key players, market segments, application areas, and market growth strategies.
Events Industry Market Report Highlights
Analyst Review
According to the perspective of the top-level CXOs, the events industry is growing at a significant pace, and is anticipated to continue this trend in the coming years. Events are playing a vital role in revenue generation and brand equations for corporates and associations. It has been witnessed that events of the recent years are equally interesting than the past decade, driving shifts in choice and pressurizing event planners and owners. This industry is witnessing the entry of new and independent players who are leveraging technology to gain a competitive advantage in today’s consolidated environment.
However, companies are facing challenges in this industry to manage live inventory for simple and small events. Conversely, the focus of companies is to enhance attendee experience and witness successful completion of an event without any hindrance. The events industry serves as a potent means for businesses to establish meaningful connections with their customers, employees, and partners. In an increasingly digital world, the events sector is poised to undergo further advancements and expansion. By leveraging events, companies can foster valuable relationships, enhance brand visibility, and create impactful experiences that contribute to their overall success and growth. In response to the ongoing evolution of technology and shifting consumer preferences, businesses will proactively adjust their event strategies to maintain relevance and effectively engage their target audiences.
Furthermore, there is a growing trend in the corporate events sector driven by businesses seeking innovative ways to enhance employee and customer engagement. Now-a-days customers seek distinctive, impactful experiences that leave a long lasting impression for them. This growing demand is expected to be effectively addressed by the event industry in the coming years. The global events industry is a dynamic and growing industry. There are many different perspectives on the future of the industry, but all of them agree that it is projected to witness continued growth.
- Travel Destinations
- Hotel Accommodations
- Event Planning
- Guest Experience
- Luxury Accomodation
- Hotel Amenities
- Food Catering
- Event Venues
- Travel Hospitality Trends
- Music Trends
The global events industry by type market was valued at $1,135.4 billion in 2019, and is projected to reach $2,046.7 billion by 2032, registering a CAGR of 6.4%.
The forecast period in the Events industry market report is 2019 to 2032.
The base year calculated in the Events industry market report is 2019.
The sponsorship segment is the most influential segment in the Events industry market report.
The company profile has been selected on the basis of revenue, service offerings, and market penetration.
The top companies analyzed for global Events industry market report are Access Destination Services, BCD GROUP (BCD MEETINGS & EVENTS), ATPI Ltd., Riviera Events, Entertaining Asia, Live Nation Worldwide Inc., StubHub, Anschutz Entertainment Group, Pollstar, Cvent Inc., Capita Plc., Reed Exhibitions, Questex LLC, Outback Concerts, The Freeman Company, Penguins Limited, CL Events, Seven Events Ltd., Clarion Events Ltd., and Versatile Event Management.
Europe holds the maximum market share of the Events industry market.
The market value of the Events industry market in 2019 was $1,135.4 billion.
Loading Table Of Content...
Loading Research Methodology...
- Related Report
- Global Report
- Regional Report
- Country Report
Enter Valid Email ID
Verification code has been sent to your email ID
By continuing, you agree to Allied Market Research Terms of Use and Privacy Policy
Advantages Of Our Secure Login

Easily Track Orders, Hassel free Access, Downloads

Get Relevent Alerts and Recommendation

Wishlist, Coupons & Manage your Subscription

Have a Referral Code?
Enter Valid Referral Code
An Email Verification Code has been sent to your email address!
Please check your inbox and, if you don't find it there, also look in your junk folder.
Events Industry Market
Global Opportunity Analysis and Industry Forecast, 2023-2032
Time to move: Sporting goods 2024
As the world continued its uneven progress in 2023, the sporting goods industry faced familiar challenges. Economic headwinds, persistent inflation, and regional conflicts undermined consumer confidence, while companies continued to struggle with inventories—mainly overstocking, because anticipated demand failed to materialize. But the industry demonstrated its resilience again. Revenue growth in 2023 was 6 percent (compared with 2 percent in 2022) amid stronger performance across geographies. 1 Euromonitor, October 2023.
As we begin 2024, this report highlights a renewed sense of optimism among industry leaders. This reflects opportunities arising from an improving market environment and new consumer preferences. More people are choosing sports that are quicker to pick up, require less commitment, and are more social, rather than organized sports with fixed time commitments or requirements for teams or high levels of skill. Participation as a driver has become as important as performance. And after supply–demand imbalances in the recent period, companies are turning to integrated business planning and analytics to help them navigate more volatile times. Meanwhile, sporting ecosystems and the demands of sustainability offer potential for innovation. With these themes in mind, this year’s sporting goods report paints a picture of an industry at a pivotal moment, facing not only challenges but also opportunities to achieve sustained growth.
Review of the past year and looking ahead
The past year was one in which regional differences were prominent. Companies in Western Europe posted growth of 8 percent, a strong rebound from the 3 percent decline the previous year, while the industry in Asia–Pacific saw income rise 11 percent after a 4 percent decline in 2022. North American companies followed 6 percent growth in 2022 with growth of 2 percent. Latin America, meanwhile, was the standout performer, with growth of 22 percent after 20 percent growth the previous year. 2 Euromonitor, October 2023.
A report on the global sporting goods industry
The World Federation of the Sporting Goods Industry (WFSGI) and McKinsey are proud to continue our partnership to present our fourth annual sporting goods industry report, Time to move: Sporting goods 2024 . The report dives into the dynamics driving performance in the sporting goods market and presents insights from some of the industry’s most senior players. As in past editions, we focus on the key trends that have affected the industry over the past year and will shape performance in the coming year and beyond. This article summarizes some of the report’s findings.
The industry’s super winners, which are companies that have consistently grown revenues and expanded margins since 2017, maintained their momentum in 2023. The group outperformed the market by focusing on attractive categories and employing smart go-to-market strategies to inspire and engage with consumers. These leaders exemplified the merits of a balanced portfolio, with retail innovation, trend-responsive branding, and cost-effective manufacturing among the pillars that supported growth.
There were also notable variations in the competitive landscape. For example, competition intensified in China, with global titans losing their edge to local players, which had a market share of about 60 percent among the top 20 brands. Conversely, in Latin America, global players continued to dominate, with a share of about 90 percent amid a strong soccer and tennis focus.
In 2023, macro factors including geopolitical conflict, inflation, and consumer conservatism, as well as inventory challenges, have made for a bumpy year and required companies to allocate more resources to promotional activities. That said, we continue to manage things in our control to the best of our ability and remain optimistic due to the enduring trend of fitness and health and our long-term growth potential, especially given our brand’s strong positioning. Stephanie Linnartz, president and CEO, Under Armour
Looking ahead, the industry is set to continue its steady growth: analysts estimate CAGR of about 7 percent by 2027 (Exhibit 1).
Rising levels of polarization
In an unpredictable market environment, a key trend is rising levels of polarization, with some companies performing much better than others. About a third of sporting goods companies have grown revenues and widened margins since 2017, forming an elite group of winners that consistently outperform the wider market. On average, this group has achieved organic growth of five percentage points and margin improvements of three percentage points over the period. Conversely, about a quarter of companies have been margin-accretive laggards—in other words, they have lifted margins but not revenues. About 10 percent are dilutive laggards, seeing strong revenue performance (more than 15 percent) but slightly negative margin performance (two percentage points on average). We expect this polarization theme to persist in the future.
I think the difficult thing in the current environment is that so many variables are changing at one time—COVID-19–related shutdowns, supply chain disruptions, geopolitical uncertainty, and inflation. Getting into this season, most brands and retailers built too much inventory, so 2024 is therefore going to be a little bit of a clean-up year. Hugo Maurstad, managing partner, Monte Rosa Capital
Sporting goods trends for 2024
In the first chapter of the report, we highlight an improving industry outlook, with about 90 percent of sporting goods leaders anticipating stability or improvements in sales and margins, according to the McKinsey and World Federation of the Sporting Goods Industry (WFSGI) Sporting Goods Industry Report Survey 2023. Still, industry leaders are not universally optimistic, amid persistent concern over inflation and overstocking. Eighty-one percent of respondents to this year’s survey say inflation and inventory levels and cost of capital are a continuing challenge, and 50 percent worry about attracting talent and the pressing imperative to become more sustainable. In addition, economic headwinds may still apply. In China, for example, 2023 marked a recovery from a tough 2022, but many Chinese consumers will likely trade down in 2024 as tough economic conditions persist.
In the remaining four chapters of this year’s report, we dive into the key themes that will likely appear on executive agendas in the year ahead:
1. Shifting consumer preferences and generational opportunities. Consumer confidence remains subdued, but the sporting goods sector has shown it can be resilient, with many companies relatively immune to downtrading. That said, brand loyalty is declining. Also, consumer behaviors are moving away from organized sports and toward options that are more accessible. This pivot presents new avenues to growth, particularly in segments such as pickleball and paddle tennis (159 percent growth from 2019 to 2022) and off-course golf (57 percent growth from 2019 to 2022), which have seen surges in popularity (Exhibit 2).
In addition, there is a generational shift in progress, with some older demographics spending more time and money on their favorite sports and hobbies. However, demographic dynamics vary across regions, suggesting brands will need to craft age-inclusive strategies to suit their constituencies.
Our product range at Nike isn’t just about catering to a specific age group—it’s more about accessibility. We want to ensure that whether someone is a jogger, walker, marathon runner, or just looking to stay active, they find something in our range that suits their needs. Vanessa Garcia-Brito, VP, chief social & community impact officer, Nike
2. Planning, planning, planning. Inventory management remains a pressing challenge as companies grapple with overstocking and demand volatility. The rising cost of capital further complicates the outlook, compelling companies to reevaluate their established planning processes. The key to being prepared lies in integrated business planning, which can significantly improve coordination and reduce the number of surprises. Still, effective implementation requires new governance approaches and cross-functional alignments as well as standardized inputs and outputs. Companies can combine these with AI and machine learning to generate more precise end-to-end planning and forecasting (Exhibit 3).
The last three and a half years for us and the rest of the industry has been super hard on supply chain and planning. … We’re now embarking on a new system for integrated planning. It’s an end-to-end planning system to connect our entire supply chain and continue to deliver the right inventory at the right time. Dan Sheridan, chief operating officer, Brooks Running
3. From sustainability targets to actions. Regulation and corporate action are supporting nations and regions in setting and meeting their sustainability targets. In China, the European Union, and the United States, there is increasing government support for funding that will drive the energy transition.
Many sporting goods brands, including smaller companies, are now stepping up, not only setting ambitious targets but also seeking to address social and governance issues in their operations and supply chains. These steps reflect rising consumer demand for more sustainable offerings. For example, consumers increasingly value products that use organic or sustainable input materials—and are often willing to pay a premium for them. While many companies are making progress, others are still at the starting blocks. Ten impact areas along the value chain and specific initiatives in each can help companies move forward. These range from new business models to initiatives that may boost consumer awareness, and companies can assess each of these through the lens of a cost abatement curve (Exhibit 4).
4. Playing the sports ecosystem game. In the wake of some companies embracing direct-to-consumer business models, the past year has seen a renewed focus on wholesale partnerships, reflecting the understanding that consumers prefer to shop in multibrand environments. Going a step further, an increasing number of companies are embracing explicit ecosystem strategies, taking their thinking beyond channel coverage and product assortments. This reflects the fact that technological advancements and health trends are driving a shift in consumer demand from individual products to comprehensive health- and activity-centered solutions.
Companies alone cannot meet all consumer needs. But they can meet those needs through networks of companies that serve some element of the customer journey, from opportunity discovery to planning and preparing, traveling, participation, and recovery (Exhibit 5). McKinsey research shows that the activities within these steps that customers value most include finding similarly minded people, shaping products to their specific needs, obtaining insurance to reduce risks, liaising with travel agencies, and receiving support during activities. 3 McKinsey Ecosystem Strategy Hub; McKinsey Consumer Community Survey, September 2023, n = 322 (Germany and the UK). Ecosystems enable companies to cater to these demands.
The report identifies five levers for value generation in an ecosystem environment: new subscription revenues, lower customer-acquisition costs, cross-selling, commissions, and operational efficiencies.
The past year has marked a period of recalibration for the sporting goods industry, with an uneven recovery and persistent challenges. Looking ahead, we believe the most successful players will innovate to address shifting consumer demands, manage supply chain complexity, streamline operations, and seize opportunities in emerging markets and ecosystems. Through efforts in these areas and a sharp focus on execution, the industry will be well positioned to continue its positive trajectory.
Download Time to move: Sporting goods 2024 , the full report on which this article is based.
Sabine Becker is an associate partner in McKinsey’s Zurich office, where Alexander Thiel is a partner; Gemma D’Auria is a senior partner in the Milan office; and Sajal Kohli is a senior partner in the Chicago office.
The authors wish to thank Rajat Agarwal, Becca Coggins, Asina de Branche, Karl-Hendrik Magnus, Olga Ostromecka, Daniel Zipser, all members of WFSGI, and the many industry experts who generously shared their perspectives during interviews for this article.
Explore a career with us
Related articles.

The trends defining the $1.8 trillion global wellness market in 2024

The State of Fashion 2024: Finding pockets of growth as uncertainty reigns

Sporting goods 2023: The need for resilience in a world in disarray

Global Ethylene Market to Reach 406.5 Million Tonnes by 2030
The global market for Ethylene estimated at 316.8 Million Tonnes in the year 2023, is expected to reach 406.5 Million Tonnes by 2030, growing at a CAGR of 3.6% over the analysis period 2023-2030.
The current market scenario and outlook for ethylene depict a robust global market, with the US anticipated to dominate. Asia is also a significant player in the ethylene market. Bio-based ethylene is gaining traction, reflecting growing environmental concerns. Polyethylene stands out as the largest category within the ethylene market.
LDPE Application, one of the segments analyzed in the report, is expected to record a 4.1% CAGR and reach 196.1 Million Tonnes by the end of the analysis period. Growth in the HDPE Application segment is estimated at 3.6% CAGR for the next 7-year period.
The U.S. Market is Estimated at 85.7 Million Tonnes, While China is Forecast to Grow at 6.2% CAGR
Historical data shows the evolution of ethylene production in the US and globally. Forecasts indicate a substantial increase in global ethylene production capacity by 2030. Distribution demand across various products highlights the versatility of ethylene applications. Specific country data, such as South Korea's ethylene demand and UK's ethylene exports, provide insights into regional dynamics. Competitive dynamics in the ethylene market are expected to intensify, with key competitors vying for market share in 2024.
The Ethylene market in the U.S. is estimated at 85.7 Million Tonnes in the year 2023. China, the world's second largest economy, is forecast to reach a projected market size of 83 Million Tonnes by the year 2030 trailing a CAGR of 6.2% over the analysis period 2023 to 2030. Among the other noteworthy geographic markets are Japan and Canada, each forecast to grow at 1.9% and 3% respectively over the 2023-2030 period. Within Europe, Germany is forecast to grow at approximately 2.4% CAGR. Led by countries such as Australia, India, and South Korea, the market in Asia-Pacific is forecast to reach 53.3 Million Tonnes by the year 2030.
MARKET OVERVIEW
- Influencer Market Insights
- World Market Trajectories
- Ethylene: Current Market Scenario and Outlook
- Ethylene Market Drivers and Restraints
- Cost Analysis
- Global Ethylene Market Outlook
- US to Dominate the Ethylene Market
- Bio-Based Ethylene Market Overview
- Polyethylene: The Largest Category of Ethylene Market
- US Ethylene Production in Million Metric Tons for the Period 1990-2018
- Global Ethylene Production Capacity in Million Metric Tons for the Period 2018 and 2030
- Global Ethylene Distribution Demand by Percentage Market Share by Product for the Period 2015
- South Korea Ethylene Demand in Million Metric Tons for the Period 2006-2018
- UK Ethylene Exports by Value in Thousand GBP for the Period 2010- 2019
- Ethylene - Global Key Competitors Percentage Market Share in 2024 (E)
- Global Polyethylene Percentage Market Share by Application for the Period 2016
- Global Ethylene Market by Percentage Share by End Use for the Period 2017
- Global Ethylene Market Share by Volume by End Use for the Period 2013 and 2020
- Global Economic Update
- Competitive Market Presence - Strong/Active/Niche/Trivial for Players Worldwide in 2024 (E)
FOCUS ON SELECT PLAYERS (Total 44 Featured):
- China Petroleum & Chemical Corporation (SINOPEC)
- E. I. du Pont De Nemours and Company
- Exxon Mobil Corporation
- LyondellBasell Industries NV
- Royal Dutch Shell PLC
- SABIC (Saudi Basic Industries Corporation)
For more information about this report visit https://www.researchandmarkets.com/r/j3ux9i
About ResearchAndMarkets.com
ResearchAndMarkets.com is the world's leading source for international market research reports and market data. We provide you with the latest data on international and regional markets, key industries, the top companies, new products and the latest trends.
ResearchAndMarkets.com Laura Wood, Senior Press Manager [email protected] For E.S.T Office Hours Call 1-917-300-0470 For U.S./ CAN Toll Free Call 1-800-526-8630 For GMT Office Hours Call +353-1-416-8900

Industry Statistics
Browse statistics for thousands of industries around the world, united states, new zealand, united kingdom.
And get full access to all statistics. Starting from $2,388 USD per year!
Trusted by more than 23,000 companies
Trending statistics
Get facts and insights on topics that matter, may 10, 2024 | music, most streamed eurovision songs on spotify worldwide 2024.
As every year, the Eurovision song contest gives stage to bands and artists selected by the European and Europe-adjacent nations (as well as Australia), to compete for the the Eurovison trophy. In 2024, the contest was hosted by Sweden in Malmö, following Loreen's second win in the competition the year before. The Italian song "La noia" by artist Angelina Mango was streamed over 60 million times on Spotify until the day before the competition, making it the most streamed song from Eurovision 2024 on the platform. Croatia's Baby Lasagna, the favorite to win the contest, stood at 8th position and recorded 6.5 million streams.
May 7, 2024 | Video Streaming
Quarterly disney+ subscribers count worldwide 2020-2024.
In the second quarter of 2024, the number of global Disney+ subscribers amounted to 153.6 million. This marked a decline of around four million compared with the same quarter of the previous year, amid further price increases of the service in October 2023.
The Walt Disney Company launched its highly anticipated streaming service in November 2019. Less than two years later, Disney+ reached a significant milestone by amassing 100 million subscribers worldwide – which is even more impressive considering that the company had initially set a goal of 60 to 90 million users by 2024. By comparison, it took SVOD market leader Netflix roughly a decade to reach the 100-million-mark, despite having navigated a much less competitive market then.
What makes Disney+ so appealing to audiences is not just its repertoire of animated classics but also the vast range of content from Disney’s various subsidiaries. The House of Mouse has acquired Lucasfilm, 20th Century Studios, Pixar, and Marvel Entertainment over the last few years, setting it up for success with viewers of all ages. In 2022, for example, “Moon Knight” and “Obi-Wan Kenobi,” available exclusively on Disney+, were among the five most popular original series releases worldwide .
May 2, 2024 | Travel, Tourism & Hospitality
Number of international tourist arrivals worldwide 1950-2023.
The number of international tourist arrivals worldwide increased in 2023 compared to the previous year. That said, it remained still below the figure reported in 2019, before the impact of the COVID-19 pandemic. After declining with the onset of the health crisis to roughly 407 million, the lowest figure recorded since 1989, global inbound tourist arrivals showed strong signs of recovery in the following years, totaling just under 1.3 billion in 2023.
Since 2005, Europe has been the global region attracting the highest number of international tourists . While inbound tourist arrivals in Europe rose significantly in 2023 over the previous year, they did not catch up yet with pre-pandemic levels. Within this region, Southern and Mediterranean Europe was the most popular area for international tourism , recording around 265 million arrivals in 2022.
According to Statista Mobility Market Insights, the global travel and tourism market's revenue - including hotels, package holidays, vacation rentals, and camping - amounted to nearly 860 million U.S. dollars in 2023, recovering from the impact of COVID-19. When breaking down travel and tourism's revenue worldwide by sales channels , it emerges that the online channel generated over two-third of the global transactions' value that year.
May 6, 2024 | Semiconductors
Semiconductor materials market revenue worldwide 2019-2023, by region.
The global semiconductor materials market generated revenues of 66.72 billion U.S. dollars in 2023, of which 19.18 billion U.S. dollars was consumed in Taiwan. A further 13.09 billion U.S. dollars was consumed in China.
May 8, 2024 | Apps
Monthly global downloads of temu shopping app 2022-2024.
The popularity of ecommerce platform Temu has been surging since its debut in the fall of 2022. In April 2024, the app was downloaded over 46 million times all over the world, making it more popular than Amazon’s marketplace app.
Temu, which is owned by the Chinese online retailer PDD Holdings, has successfully replicated the meteoric growth of its sister app Pinduoduo in overseas markets through effective marketing campaigns. Focusing on providing low-cost products with free and fast shipping, Temu has emerged as a wallet-saving alternative amidst rising inflation . The newcomer has also followed the playbook of Pinduoduo, such as gamification features and personalized purchase recommendations, to make shopping on mobile more fun.
These strategies work. In the first five months of 2023, Temu generated over 1.5 billion U.S. dollars in gross merchandise volume. It has caught the eye of inflation-weary shoppers in the West, particularly young people in the United States and Mexico. In April 2023, Temu achieved its first milestone of over 100 million active users in the United States.
May 3, 2024 | Employment
U.s. seasonally adjusted unemployment rate 2022-2024.
The seasonally-adjusted national unemployment rate is measured on a monthly basis in the United States. In April 2024, the national unemployment rate was at 3.9 percent. Seasonal adjustment is a statistical method of removing the seasonal component of a time series that is used when analyzing non-seasonal trends.
According to the Bureau of Labor Statistics - the principle fact-finding agency for the U.S. Federal Government in labor economics and statistics - unemployment decreased dramatically between 2010 to 2019. This trend of decreasing unemployment followed after a high in 2010 resulting from the 2008 financial crisis. However, after a smaller financial crisis due to the COVID-19 pandemic unemployment reached 8.1 percent in 2020. As the economy recovered the unemployment rate fell to 5.3 in 2021, and fell even further in 2022. Additional statistics from the BLS paint an interesting picture of unemployment in the United States. In November 2023, the states with the highest (seasonally adjusted) unemployment rate were the Nevada and the District of Columbia. Unemployment was the lowest in Maryland, at 1.8 percent. Workers in the agricultural and related industries suffered the highest unemployment rate of any industry at seven percent in December 2023.
May 10, 2024 | Apps
Monthly active users of leading music apps in china 2024.
As of February 2024, Tencent's music apps - KuGou, QQ, and Kuwo - were the three most popular music streaming apps in China. The monthly active users of KuGou totaled to around 350 million, whereas Baidu's rebranded Qian Qian amassed around 5.7 million monthly active users.
Globally, Tencent is one of the biggest music streaming providers. The Chinese tech behemoth owns the largest music company in the country – Tencent Music Entertainment (TME). With roughly 60 percent of the local music market share, TME had reported a profitable financial status since its founding in 2016. Besides, its monthly active users rose to 600 million – capturing most of the mobile music userbase in the country. Among its music apps, KuGou Music was found to be favored by those who aged between 19 and 28, while QQ Music was more preferred among older users.
Although the usage of mobile music streaming is high among Chinese netizens, most of them are not familiar with paying for the services. Music streaming platforms can hardly generate high revenue per user . They are more likely to opt for free sources to access their choice of music. In 2020, paying members was estimated to make up about eight percent of the total music userbase in China. To address the problem, industry experts suggested to raise public awareness of copyright protections.
May 8, 2024 | National Security
Eu military defense: defense expenditure 2005-2022, by member states.
As of 2022, the European Union member states spent almost 240 billion Euros collectively on military defense. This includes money spent on procuring weapons, paying salaries, and other operational costs, as well as research & development expenditure. The total amount spent on defense declined significantly following the global financial crisis, as European countries cut back on public expenditure, reaching a low point of 138 billion Euros in 2012. Since 2014, when Russia reemerged as a geopolitical threat to EU countries, due to its illegal annexation of Crimea from Ukraine and its covert military operations in the east of that country, military expenditure has increased sharply, rising particularly in Poland and Germany. Despite this, Germany still lags far behind the spending target set for it by NATO and the European Defence Agency of two percent of GDP.
May 9, 2024 | Elections
Voting intention in the united kingdom 2017-2024.
In May 2024, 48 percent of British adults would vote for the Labour Party in a general election, compared with 18 percent who would vote for the Conservative Party. The ruling Conservatives have trailed Labour in the polls throughout 2022 and 2023, with a huge gap emerging in September 2022 when Liz Truss came to power. Truss' short time as Prime Minister was widely seen as a disaster for the country and her party, and she was succeeded by Rishi Sunak as Prime Minister that October. Labour has maintained their lead in the polls since Sunak became Prime Minister, and would win the next general election based on the most recent polls.
The next UK general election is expected in 2024, but may take place as late as January 2025. Unlike many other democracies, general elections in the UK have no fixed date, with the power to call one resting with the Prime Minister, although this must be done at least every five years. While the last election in 2019 was held in the winter, it is unlikely that Sunak will wait until then to call an election, with a Spring or Autumn election in 2024 the most likely scenario. It may suit the Conservatives to bide their time until the Autumn, however, in the hope that the economic situation improves, giving a lift to Sunak's job rating and a boost to the government's sinking approval ratings . The job of catching Labour in the polls in 2024 may be a long shot for the Conservatives, especially as no ground was made up in 2023.
After a tough 2022, in which Britain suffered through its worst cost of living crisis in a generation, the economy was consistently identified as the main issue facing the country , just ahead of healthcare. To respond to these concerns, Rishi Sunak started 2023 with five pledges; halve inflation, grow the economy, reduce national debt, cut NHS waiting times, and stop small boats. One year on from this announcement, just one pledge can be said to be realized, with CPI inflation falling from 10.1 percent at the start of the year to 3.9 percent by November. There is some ambiguity regarding the success of some of the other pledges. The economy shrank in the third quarter of 2023, the national debt has increased slightly, while small boat arrivals are down from 2022, but still higher than in most other years. The pledge to cut NHS waiting times was not fulfilled either, with the number of people awaiting treatment rising in 2023.
May 2, 2024 | Crime & Law Enforcement
Safest countries in africa 2024.
In 2024, Rwanda was the safest country in Africa. It had a score of roughly 73.2 points in the safety index, making it the African nation with the lowest crime incidents and the only country with high safety levels - over 60 index points. In several other countries in Africa, the level of safety was considered moderate (40 to 60 index points).
Popular topics
Starting point of your research.
- Agriculture
- Pharmaceuticals
- Advertising
- Video Games
- Virtual Reality
- European Union
- United Kingdom
Market Insights
Discover data on your market
Gain access to valuable and comparable market data for over 190+ countries, territories, and regions with our Market Insights. Get deep insights into important figures, e.g., revenue metrics, key performance indicators, and much more.
All Market Insights topics at a glance
Statista accounts
Our complete solutions, basic account, get to know us.
- Access to basic statistics
- Download as PDF & PNG
Starter Account
The ideal entry-level account for individual users.
- Full access to all statistics
- Stand-alone license
Professional Account
Our company solution.
- All functions of the Starter Account
- Access to dossiers, forecasts, studies
*All products require an annual contract. Prices do not include sales tax.
Global stories vividly visualized
Consumer insights, understand what drives consumers.
The Consumer Insights helps marketers, planners and product managers to understand consumer behavior and their interaction with brands. Explore consumption and media usage on a global basis.
Our Service
Save time & money with statista, trusted content.
With an increasing number of Statista-cited media articles, Statista has established itself as a reliable partner for the largest media companies of the world.
Industry expertise
Over 500 researchers and specialists gather and double-check every statistic we publish. Experts provide country and industry-based forecasts.
Flatrate access
With our solutions you find data that matters within minutes – ready to go in your favorite format.
Mon - Fri, 9am - 6pm (EST)
Mon - Fri, 9am - 5pm (SGT)
Mon - Fri, 10:00am - 6:00pm (JST)
Mon - Fri, 9:30am - 5pm (GMT)
IMAGES
VIDEO
COMMENTS
The global revenue of the market research industry exceeded 84 billion U.S. dollars in 2023 and has grown more than twofold since 2008. In 2022, North America generated the largest share of market ...
The global market research industry generates more than $118 billion in annual revenue. 1. Pharmaceutical companies account for 16.6% of global market research spending. 1. 89% of market research suppliers and clients regularly use online surveys. 2. 23% of organizations don't have a clear market research strategy. 3.
2024. $140 billion. Between 2021 and 2024, the market research industry grew by 37.25% from $102 billion to $140 billion - ESOMAR. When ranked by market research turnover, the US market leads the ranking with $48 billion, followed by the UK ($9.1 billion) and China ($2.88 billion) - ESOMAR. Note: Data as of 2021.
An even higher growth rate is expected in the future. The global market research services market is forecast to grow from $76.37 billion in 2021 to $108.57 billion in 2026 at a CAGR of 7.29 percent. The Role of Market Research. Companies in this industry gather, analyze, and present marketing and public opinion data.
Expert industry market research on the Market Research in the US (2024-2029). Make better business decisions, faster with IBISWorld's industry market research reports, statistics, analysis, data, trends and forecasts.
The market research industry is a sector that focuses on gathering, analyzing, and interpreting data about markets, consumers, competitors, and various business-related trends. ... Between 2016 and 2020, industry revenue growth is expected to accelerate in the U.S. as more and more research firms adopt fresh, innovative methods. 2018 market ...
Streamline your research process with industry reports covering everything from established sectors to emerging markets across four continents. 5000+ Industries covered. 250k+ Hours of detailed analysis. 100k+ Subscriber community. Expert industry market research to help you make better business decisions, faster. Industry market research ...
Market Research Report. 2021 Market Research Global Trends. For market researchers, COVID-19 accelerated a transformation that's been a decade in the making — and it will completely reshape the industry in the coming years. In our first annual study into the state of the market research industry, we surveyed more than 2,000 market research ...
Industry market research reports, statistics, analysis, data, trends and forecasts. What is the market size of the Market Research industry in the US? IBISWorld's statistic shows that as of 2024 the market size of the Market Research industry is $31.7bn an increase of 2.37% from 2023.
Our award-winning syndicated market research database provides detailed data and analysis on industries and consumers, across 1200 cities, 210 countries. We use advanced analytics and data science to identify and measure the effect of disruption to the economy, industries, costs and prices. Via helps you navigate a fast-changing digital ...
Editor's Choice. In 2022, the global market research sector generated an impressive total revenue that exceeded $82 billion, representing growth of more than double compared to 2008.; In 2021, North America played a dominant role in contributing to the industry's revenue, contributing over half of the global total.Europe closely followed, accounting for approximately one-fourth of the ...
The global data analytics market size was valued at USD 49.03 billion in 2022 and is projected to grow at a compound annual growth rate (CAGR) of 26.7% from 2023 to 2030. The main factors propelling the data analytics market's expansion are the growing adoption of machine learning and artificial intelligence to offer increased acceptance of ...
The global biotechnology market was valued at USD 1.55 trillion in 2023 and is projected to grow at a compound annual growth rate (CAGR) of 13.96% from 2024 to 2030. The market is driven by strong government support through initiatives aimed at the modernization of regulatory framework, improvements in approval processes & reimbursement ...
The digital marketing industry is projected to grow at a CAGR of 13.1% between 2024 and 2032 to reach a value of around USD 1099.33 billion by 2032. ... Increased penetration of the internet across the globe is one of the major factors driving the digital marketing industry growth. This growth is further aided by the proliferation of ...
The global video game market sizewas estimated at USD 217.06 billion in 2022and is expected to grow at a compound annual growth rate (CAGR) of 13.4% from 2023 to 2030. The market's expansion is attributed to the ongoing trend of online gaming, the emergence of high bandwidth network connectivity, and the continuous demand for 3D games.
Events Industry Market Research, 2032. The global events industry market was valued at $1.1 trillion in 2019, and is projected to reach $2.1 trillion by 2032, growing at a CAGR of 6.4% from 2023 to 2032. Events refer to public gathering of populace at a determined time and place for a purpose. The purpose for staging an event can be to increase ...
The annual net growth of the market research industry in terms of revenue grew significantly between 2019 and 2022. The net growth recorded in 2022 was was 3.5 percent, 0.2 percent lower than the ...
The research offers insight into the representation of women and ethnic and racial minorities in private investing as of year-end 2022. In this chapter, we discuss where the numbers stand and how firms can bring a more diverse set of perspectives to the table. The statistics indicate signs of modest advancement.
The World Federation of the Sporting Goods Industry (WFSGI) and McKinsey are proud to continue our partnership to present our fourth annual sporting goods industry report, Time to move: Sporting goods 2024.The report dives into the dynamics driving performance in the sporting goods market and presents insights from some of the industry's most senior players.
The U.S. Market is Estimated at 85.7 Million Tonnes, While China is Forecast to Grow at 6.2% CAGR Historical data shows the evolution of ethylene production in the US and globally.
Industry Statistics (616 titles) Find statistics for thousands of industries from IBISWorld's industry research reports. We provide industry statistics on market size, number of businesses, employment and wages in Australia, Canada, China, Germany, Ireland, Mexico, New Zealand, the UK and the US. IBISWorld is the world's leading provider of ...
Dublin, May 10, 2024 (GLOBE NEWSWIRE) -- The "Music Streaming Services in the US - Industry Market Research Report" report has been added to ResearchAndMarkets.com's offering.
Global Veterinary Hospital Market was valued at USD 81.12 Billion in 2023 and is anticipated to project robust growth in the forecast period with a CAGR of 6.01% through 2029
The global beauty salon market size was valued at USD 155.60 billion in 2022 and is expected to grow at a compound annual growth rate (CAGR) of 8.0% from 2023 to 2030. The beauty salon industry encountered significant challenges during the COVID-19 pandemic. However, it is currently undergoing transformation driven by key trends, including an ...
The United States MEWP market showcased growth at a CAGR of 8.45% during 2020-2023. The market was valued at USD 566.13 Million in 2023 which is expected to reach USD 1054.22 Million in 2030.
[email protected]. Tel. +1 212 419-5774. Mon - Fri, 9am - 6pm (EST) Find statistics, consumer survey results and industry studies from over 22,500 sources on over 60,000 topics on the internet's ...
Dublin, May 14, 2024 (GLOBE NEWSWIRE) -- The "Oxytocin Market - Global Industry Size, Share, Trends, Opportunity & Forecast, 2019-2029F" report has been added to ResearchAndMarkets.com's offering ...